What Do the UK’s Most Dangerous Drivers Look Like?
An estimated 1.3 million people worldwide are fatally injured each year as a result of road collisions, and many more are affected by crashes.
Although driving in the UK is safer than in most countries in the world, and home to one of the lowest fatality rates, road collisions are not uncommon.
To find out which people in the UK are most likely to be involved in a vehicle collision, we analysed data from the Department of Transport to discover which ages, genders and locations are most affected by road accidents.
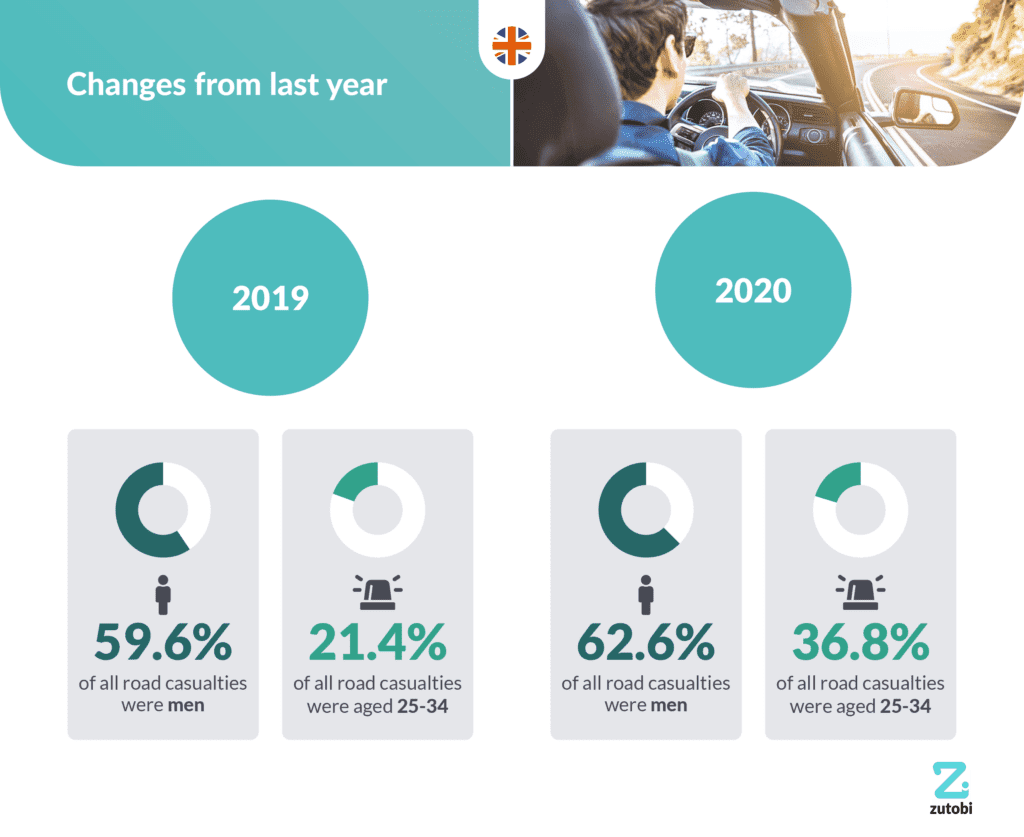
Changes from last year
With national lockdowns resulting in fewer people on the roads, a decrease in accidents and fatal injuries in 2020 can be seen, when compared to the previous year. In 2020, there were 37,574 fewer people in the UK injured in road traffic collisions than in 2019.
Although the number of casualties from road incidents has decreased, the likelihood of the most at-risk groups being involved in a crash has increased.
In 2019 men made up 59.6% of all road casualties and in 2020 the figure rose to 62.6%. A similar pattern can be seen with the age group most affected by road collisions. In 2019 those aged 25-34 accounted for 21.4% of all road casualties, while in 2020 the number rose to 22.6%.
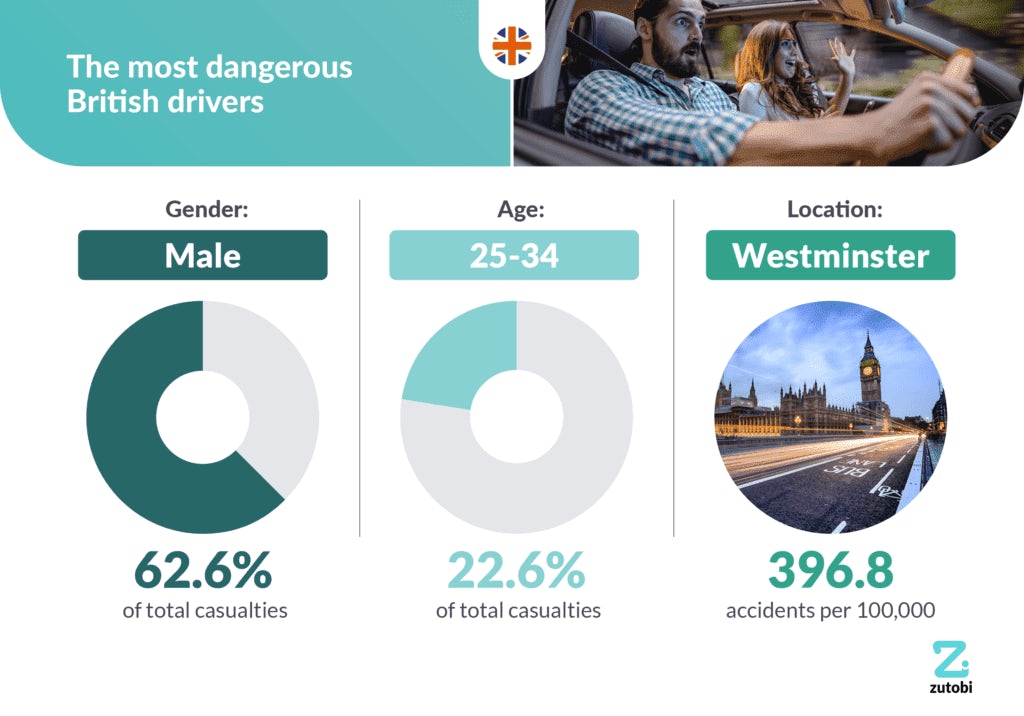
The most dangerous British drivers
Gender: Male – 62.6% of total casualties
Age: 25-34 – 22.6% of total casualties
Location: Westminster – 396.8 accidents per 100,000
These are the British drivers most likely to be involved in a road collision, based on gender, age and location. Men made up over 60% of all people involved in road accidents in the UK in 2020. The most likely age group to be involved in a crash is 25-34, with a rate of accidents around one and a half times higher than the second most likely age group to be injured. There were more accidents in the City of Westminster last year than in any other UK area.
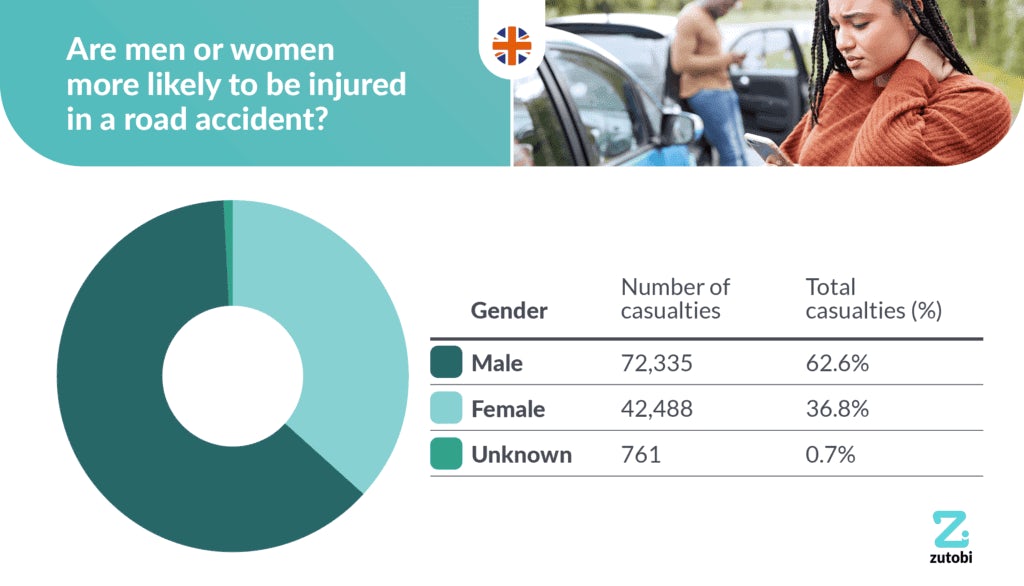
Are men or women more likely to be injured in a road accident?
Men are more likely to be involved in a road accident in the UK than women. In 2020, men made up 62.6% of all people involved in road traffic accidents, while women made up 36.8% of all casualties.
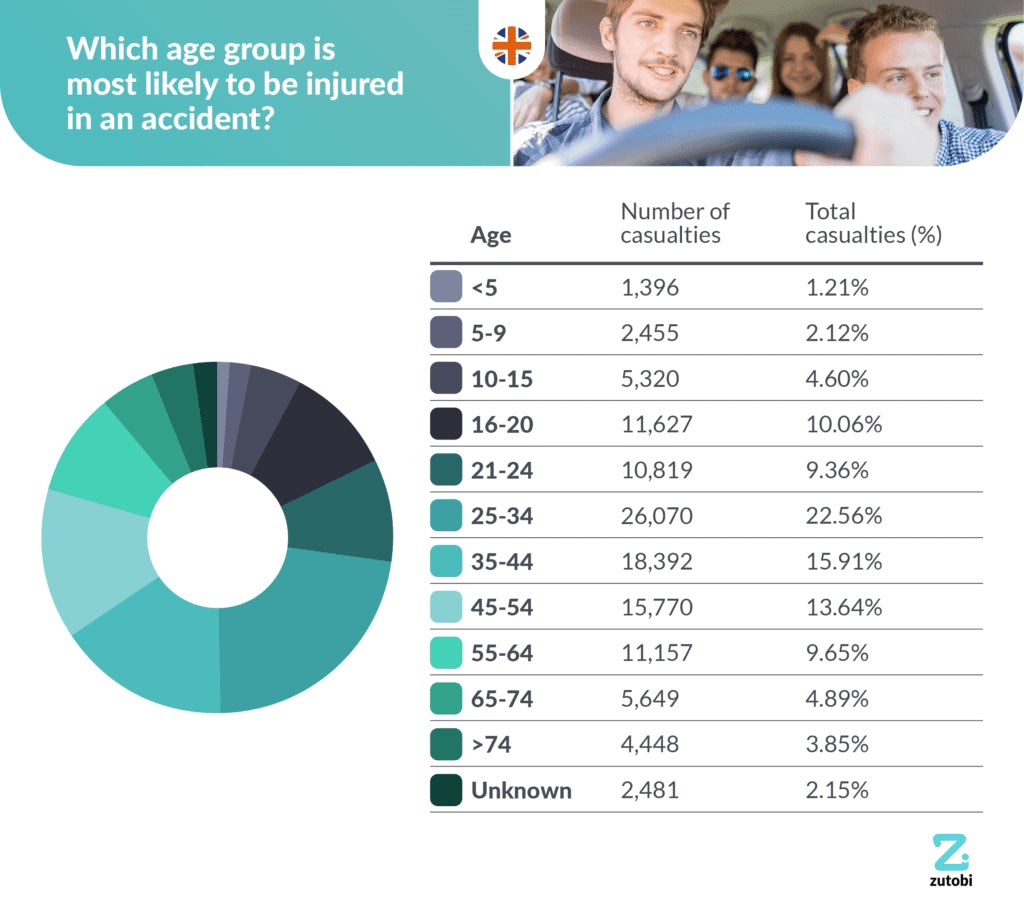
Which age group is most likely to be injured in an accident?
Those aged 25-34 are most likely to be injured in a road collision, accounting for 22.6% of all road casualties last year. The second most likely age group to be injured in a crash are those aged 35-44, who make up 15.9% of all total casualties.
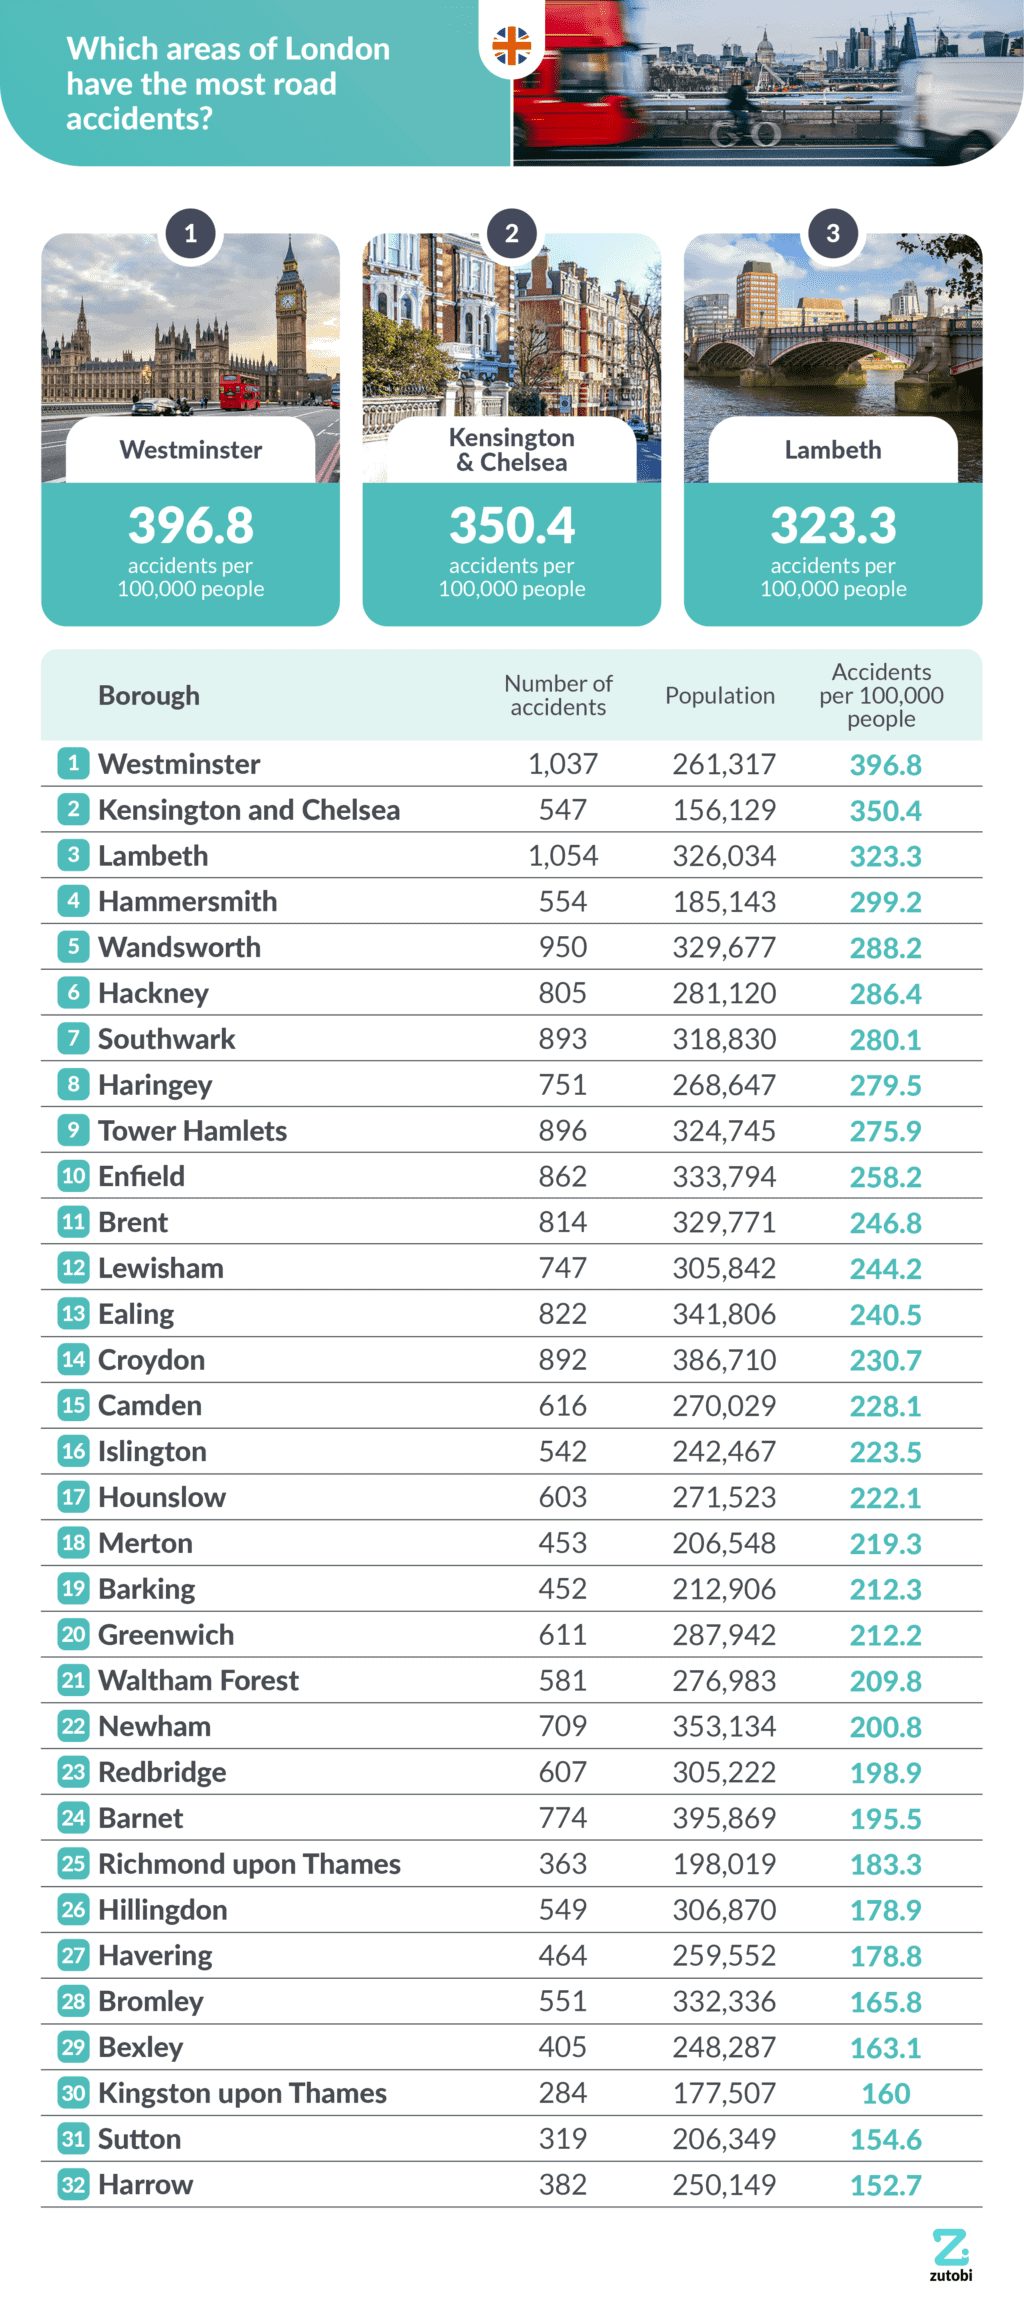
Which areas of London have the most road accidents?
1. Westminster – 396.8 accidents per 100,000 people
Home to some of Britain’s most iconic landmarks – Buckingham Palace, the Houses of Parliament and 10 Downing Street, Westminster is the UK area where you are most likely to be involved in a crash on the road. In 2020, 1,037 total accidents were recorded in the Westminster local authority (396.8 accidents per 100,000 people).
2. Kensington and Chelsea – 350.4 accidents per 100,000 people
Kensington and Chelsea comes in second place as one of the UK areas that is most affected by road collisions. In 2020, 547 road crashes occurred in the London borough (350.4 accidents per 100,000 people).
3. Lambeth – 323.3 accidents per 100,000 people
Residents of Lambeth are some of the most likely to be affected by road collisions in all of the UK. The Department of Transport recorded 1,054 total road accidents in Lambeth in 2020 (323.3 accidents per 100,000 people).
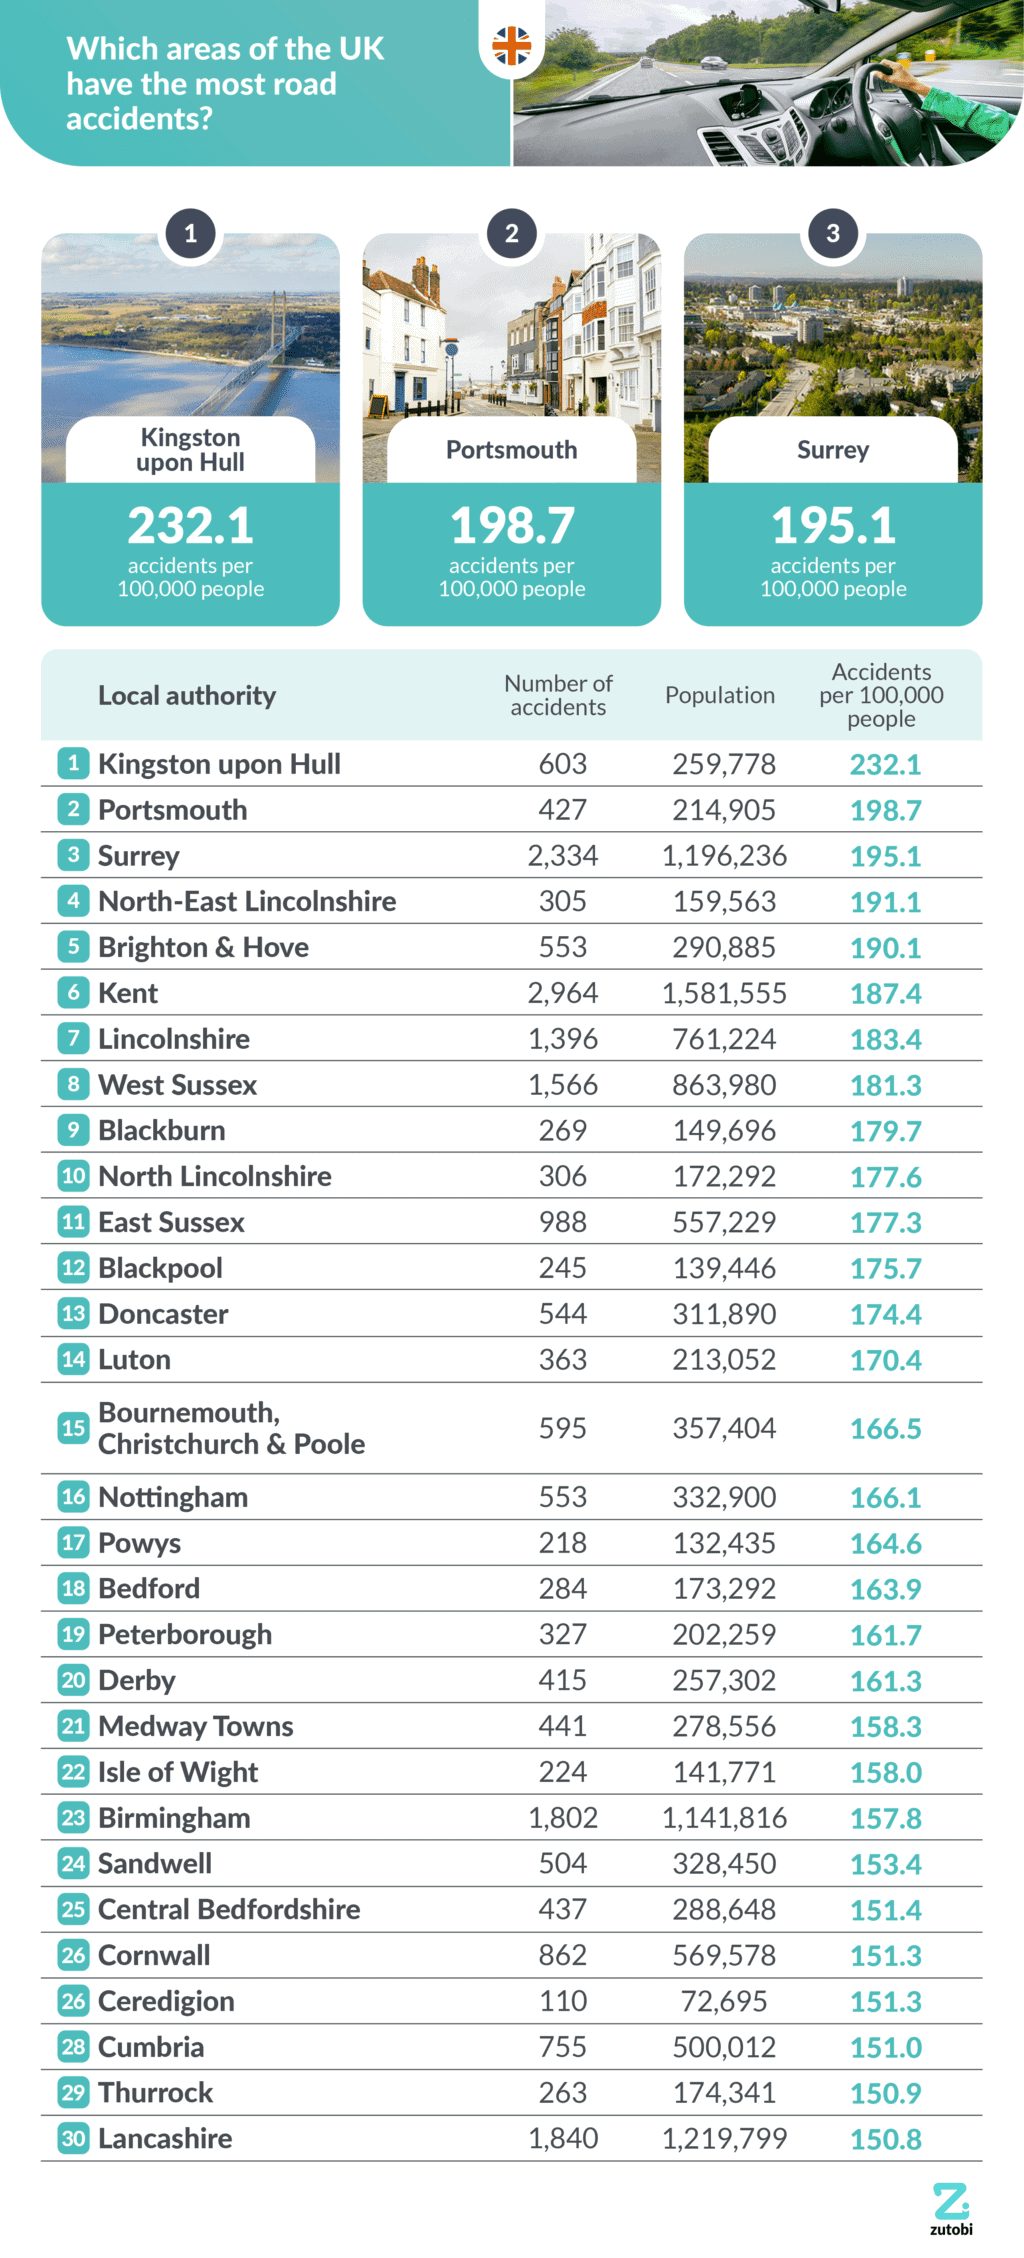
Which areas of the UK have the most road accidents?
1. Kingston upon Hull – 232.1 accidents per 100,000 people
Hull is home to the highest number of road accidents per 100,000 people out of all areas in the UK. Those in Hull are most likely to find themselves involved in a road traffic collision – there were a total of 603 accidents in Hull in 2020 (232.1 accidents per 100,000 people).
2. Portsmouth – 198.7 accidents per 100,000 people
Portsmouth has some of the most dangerous roads in the UK, as the second most common area for crashes. There were 427 total road accidents in Portsmouth in 2020 or 198.7 per 100,000 residents.
3. Surrey – 195.1 accidents per 100,000 people
Those in Surrey are among the most likely in the UK to be involved in an accident on the road. A total of 2,334 road accidents took place in Surrey during 2020 (195.1 accidents per 100,000 people).
The 2021 UK’s Most Dangerous Drivers Report
If you want to read our previous report you can download it here:
Methodology
All data was sourced from the Department for Transport’s road traffic statistics. The figures relate solely to incidents where at least one person was injured. All figures relate to crashes in 2020.

550+ exam-like questions
All you need to ace your test
Free trial
Recommended articles


Ace your theory test, guaranteed
Want to Be the Top School in Your Area?
- Simple & automated admin
- More time for teaching
- #1 learning materials for students