loved by
15.1+ million
users
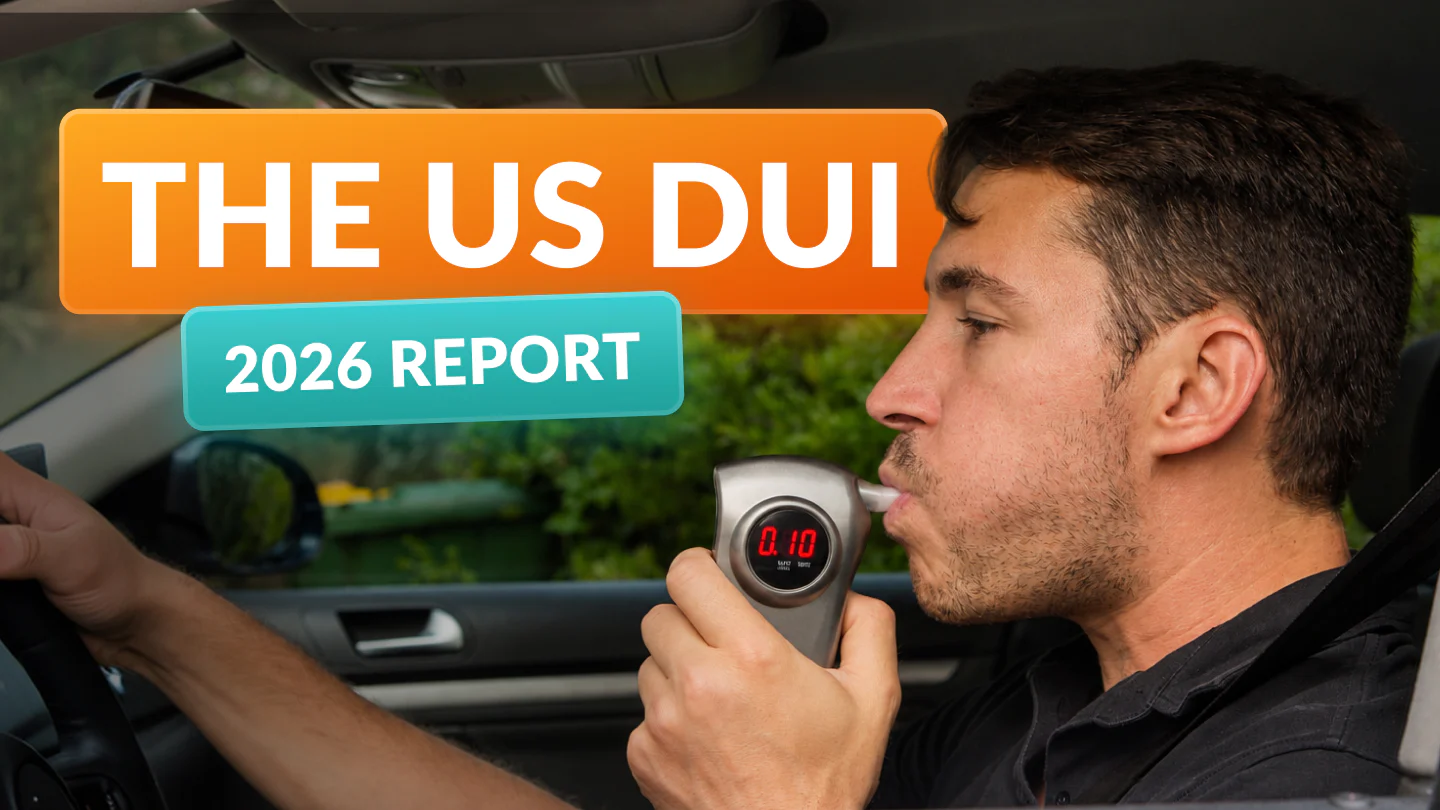
The US DUI Report: The States With the Most and Least Drunk Driving

Driving Under the Influence (DUI) remains a significant cause of road accidents and fatalities in the United States annually. The data for 2024 shows a mixed picture, with some encouraging progress alongside persistent challenges in our ongoing battle against drunk driving.
In 2024, there were 11,904 deaths attributed to drunk driving, accounting for about 30% of all road fatalities. This is a decrease from 2023, when 12,429 deaths were attributed to drunk driving (also about 30% of total traffic fatalities). That works out to a 4.2% reduction in drunk driving deaths from the year before, continuing the downward movement that followed the 2022 peak.
Despite this decrease, the 2024 figures remain higher than pre-pandemic levels. The number of drunk driving deaths is still 17.4% higher than the 10,142 fatalities recorded in 2019.
Zutobi, the leading driving education company, analyzed the data across all states to understand the variations in DUI accidents, fatalities, and arrests. Through an in-depth examination of the latest available data, we have ranked each state from best to worst, revealing where DUI-related incidents are more frequent and where states are making the most progress.
As we continue our efforts to promote road safety, it is essential to address the issue of drunk driving effectively and implement measures to prevent such tragedies. By identifying the areas with higher incidents of DUI and recognizing successful interventions, we can focus our resources and strategies to make a positive impact and save lives on our roads.
Note: Drunk driving statistics take time to collect. This report features the latest available data, covering the year 2024.
How drunk driving fatalities have changed through the years
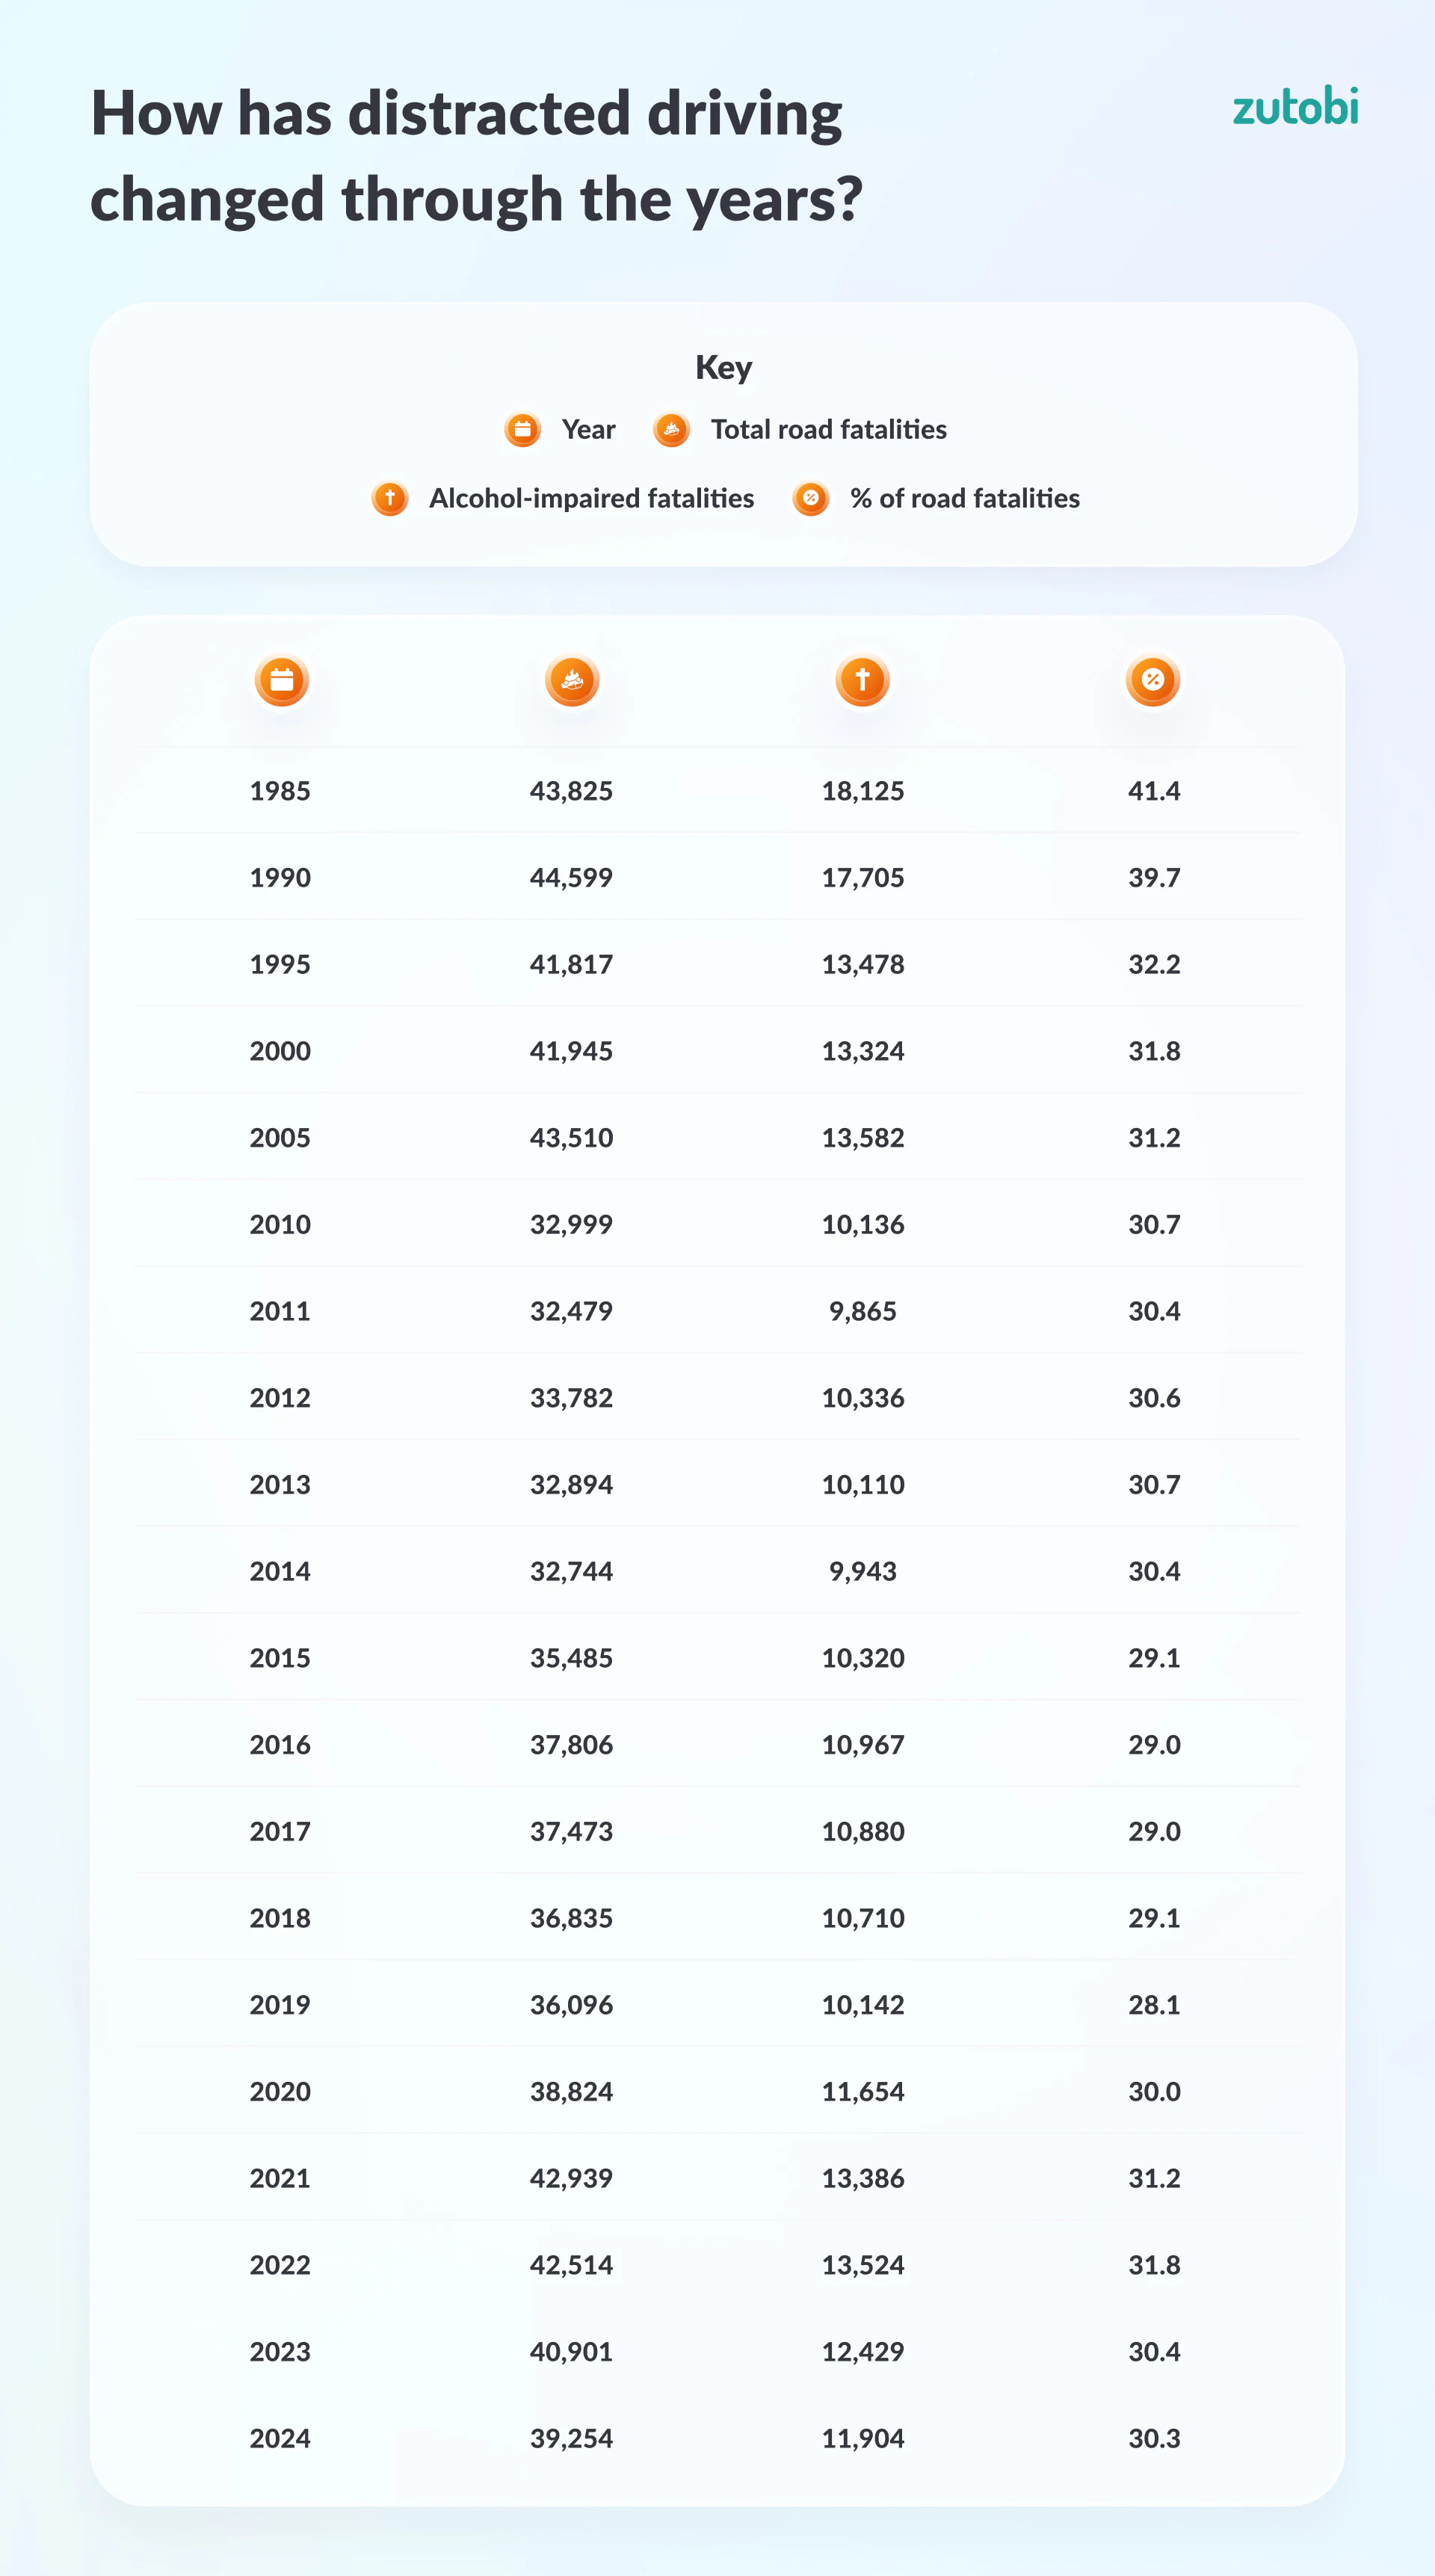
The long-term trend shows clear progress. DUI deaths have fallen from 41% of all road fatalities in 1985 to about 30% in 2024. The pandemic period interrupted that decline, but the two most recent years show it resuming.
The 2024 data shows two clear points:
- Encouraging: DUI deaths fell 4.2% from 2023 to 2024.
- Still elevated: DUI deaths remain 17.4% higher than pre-pandemic 2019 levels.
Looking at the raw counts, drunk driving deaths rose from 10,142 in 2019 to a peak of 13,524 in 2022, then fell to 12,429 in 2023 and 11,904 in 2024. Total road fatalities followed a similar path, dropping from 40,901 in 2023 to 39,254 in 2024, a decrease of about 4.0%.
The national figures hide wide differences between states, which the rankings below break down.
Is there any difference between men and women?
The gap between men and women remains wide. In 2024, 7,070 impaired male drivers died in drunk driving crashes, compared with 1,591 impaired female drivers. That is more than four times as many male deaths as female deaths.
Both numbers fell from 2023. Male fatalities dropped by 2.5% (from 7,249), and female fatalities dropped by 8.5% (from 1,739).
| State | Impaired Drivers Killed in Fatal Crashes | Impaired Drivers Killed in Fatal Crashes |
|---|---|---|
| State | Male | Female |
| Alabama | 180 | 37 |
| Alaska | 5 | 3 |
| Arizona | 217 | 54 |
| Arkansas | 106 | 23 |
| California | 712 | 141 |
| Colorado | 135 | 19 |
| Connecticut | 67 | 9 |
| Delaware | 16 | 5 |
| District of Columbia | 6 | 1 |
| Florida | 456 | 101 |
| Georgia | 192 | 44 |
| Hawaii | 21 | 1 |
| Idaho | 52 | 12 |
| Illinois | 194 | 38 |
| Indiana | 136 | 32 |
| Iowa | 77 | 17 |
| Kansas | 75 | 17 |
| Kentucky | 109 | 19 |
| Louisiana | 120 | 25 |
| Maine | 37 | 6 |
| Maryland | 94 | 27 |
| Massachusetts | 66 | 13 |
| Michigan | 188 | 46 |
| Minnesota | 73 | 17 |
| Mississippi | 95 | 28 |
| Missouri | 161 | 40 |
| Montana | 50 | 12 |
| Nebraska | 51 | 6 |
| Nevada | 72 | 21 |
| New Hampshire | 22 | 7 |
| New Jersey | 76 | 21 |
| New Mexico | 70 | 9 |
| New York | 161 | 27 |
| North Carolina | 272 | 68 |
| North Dakota | 18 | 4 |
| Ohio | 258 | 54 |
| Oklahoma | 123 | 38 |
| Oregon | 105 | 19 |
| Pennsylvania | 188 | 35 |
| Puerto Rico | 49 | 10 |
| Rhode Island | 9 | 1 |
| South Carolina | 247 | 67 |
| South Dakota | 29 | 7 |
| Tennessee | 203 | 48 |
| Texas | 920 | 244 |
| Utah | 50 | 8 |
| Vermont | 15 | 5 |
| Virginia | 163 | 31 |
| Washington | 127 | 36 |
| West Virginia | 53 | 9 |
| Wisconsin | 123 | 27 |
| Wyoming | 26 | 2 |
| Total | 7070 | 1591 |
States with the most drunk driving
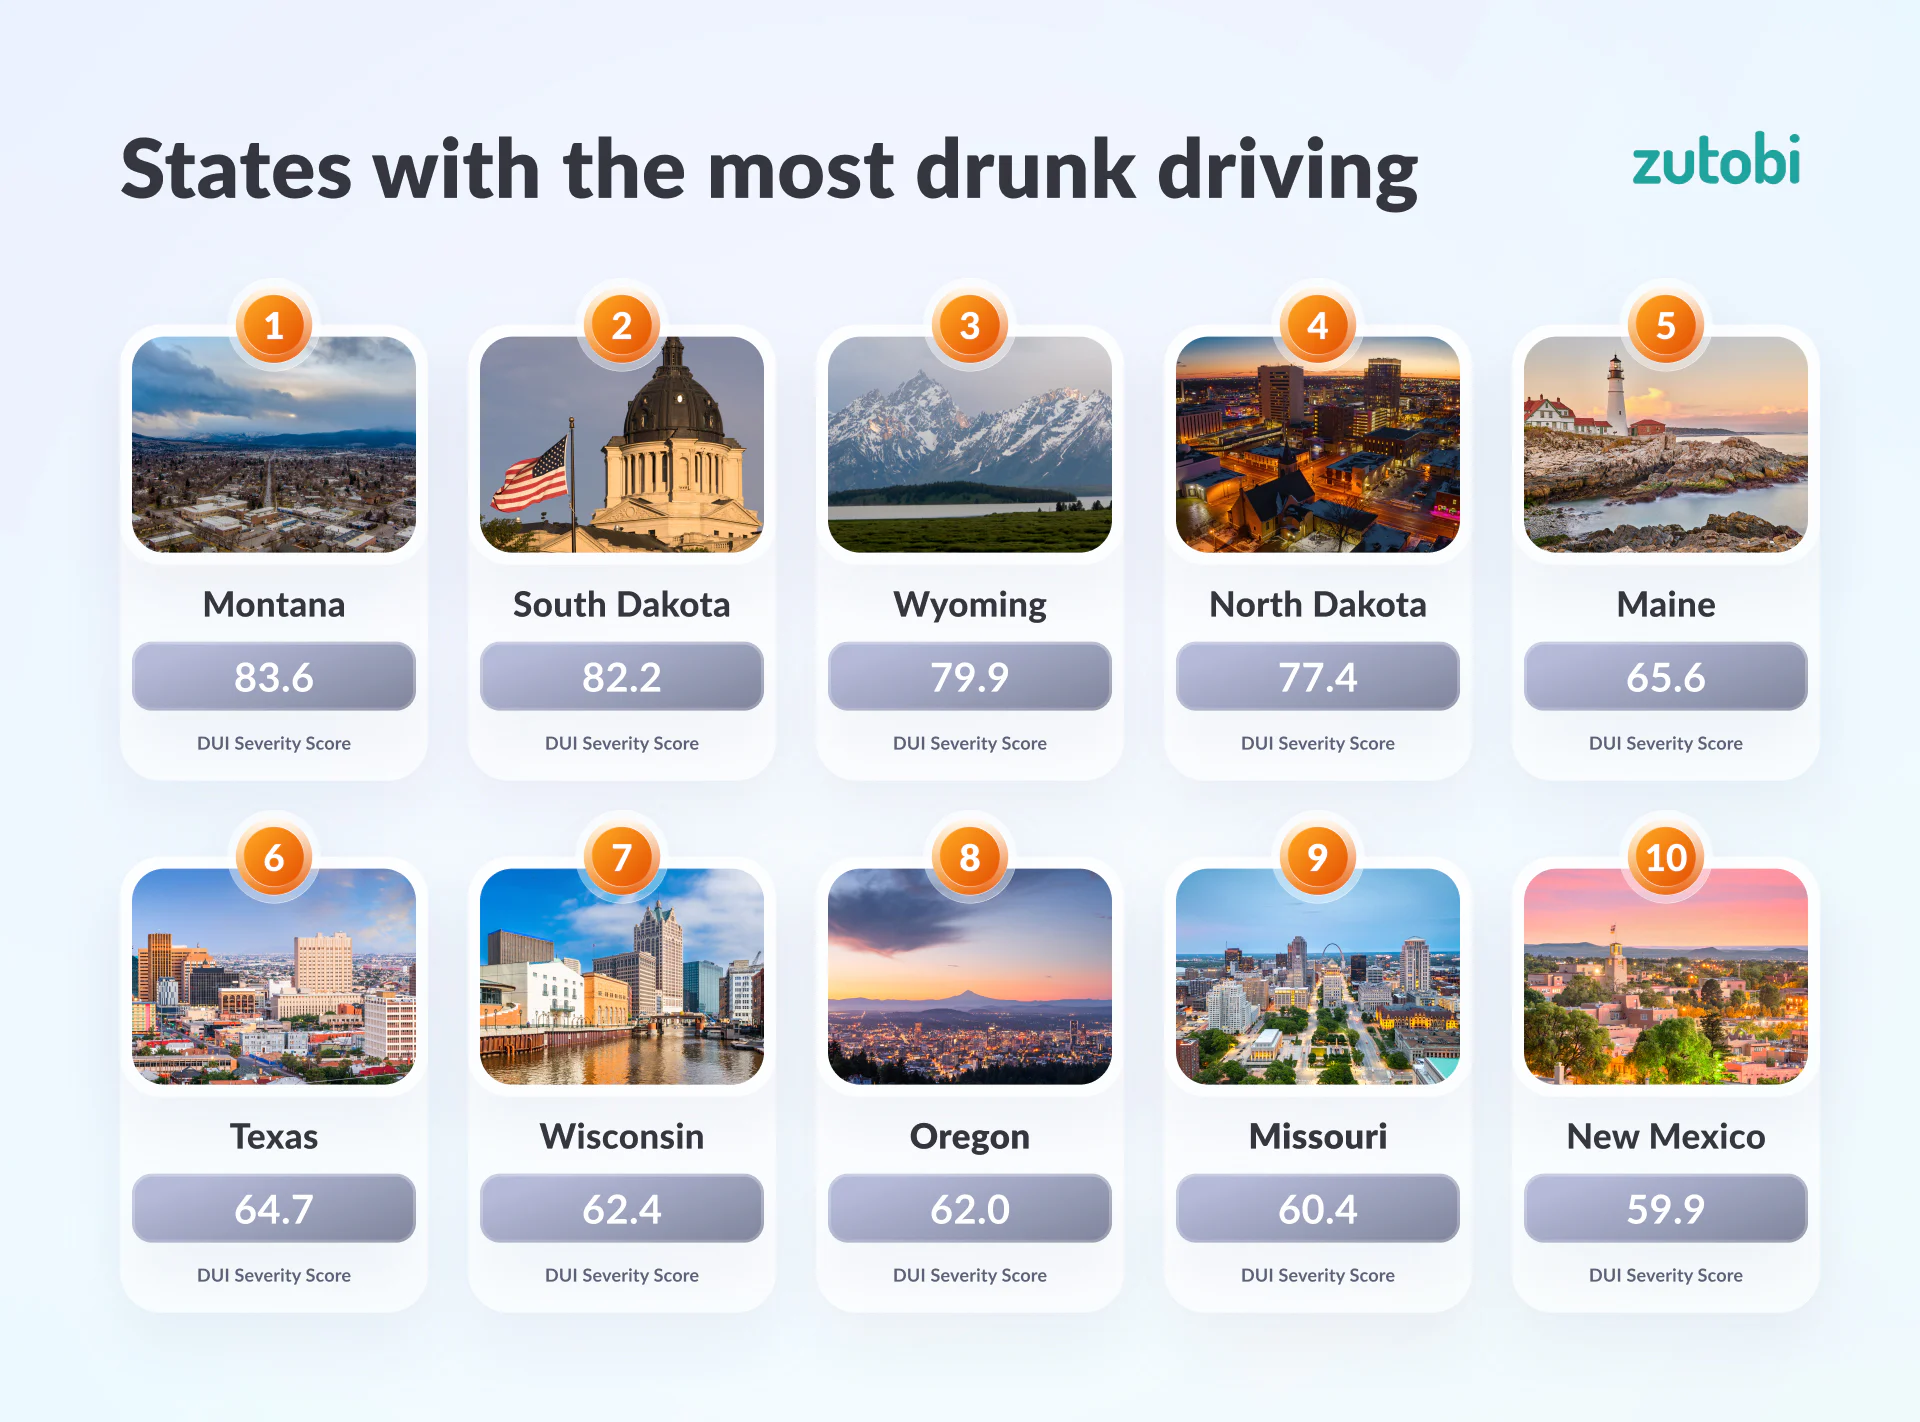
Montana recorded the highest DUI severity score at 83.6 out of 100 in 2024. The state registered 8.53 DUI road fatalities per 100,000 drivers and 531.73 DUI arrests per 100,000 drivers, with alcohol-impaired crashes accounting for 36.4% of all road fatalities.
The top 10 states with the highest DUI severity scores in 2024:
- Montana (83.6): 8.53 DUI road fatalities per 100,000 drivers, 531.73 DUI arrests per 100,000 drivers, 36.4% of total fatalities, 5.6% increase from 2023
- South Dakota (82.2): 6.17 DUI road fatalities per 100,000 drivers, 929.40 DUI arrests per 100,000 drivers, 29.5% of total fatalities, 13.2% increase from 2023
- Wyoming (79.9): 7.54 DUI road fatalities per 100,000 drivers, 719.61 DUI arrests per 100,000 drivers, 31.8% of total fatalities, 5.6% decrease from 2023
- North Dakota (77.4): 4.57 DUI road fatalities per 100,000 drivers, 915.82 DUI arrests per 100,000 drivers, 30.0% of total fatalities, 28.9% decrease from 2023
- Maine (65.6): 4.52 DUI road fatalities per 100,000 drivers, 422.16 DUI arrests per 100,000 drivers, 27.7% of total fatalities, 32.4% increase from 2023
- Texas (64.7): 8.58 DUI road fatalities per 100,000 drivers, 335.54 DUI arrests per 100,000 drivers, 40.3% of total fatalities, 1.4% decrease from 2023
- Wisconsin (62.4): 4.40 DUI road fatalities per 100,000 drivers, 451.12 DUI arrests per 100,000 drivers, 33.1% of total fatalities, 8.2% increase from 2023
- Oregon (62.0): 5.60 DUI road fatalities per 100,000 drivers, 477.60 DUI arrests per 100,000 drivers, 33.1% of total fatalities, 11.0% decrease from 2023
- Missouri (60.4): 6.07 DUI road fatalities per 100,000 drivers, 444.24 DUI arrests per 100,000 drivers, 27.5% of total fatalities, 7.1% decrease from 2023
- New Mexico (59.9): 7.30 DUI road fatalities per 100,000 drivers, 416.09 DUI arrests per 100,000 drivers, 28.1% of total fatalities, 3.4% decrease from 2023
States with the least drunk driving
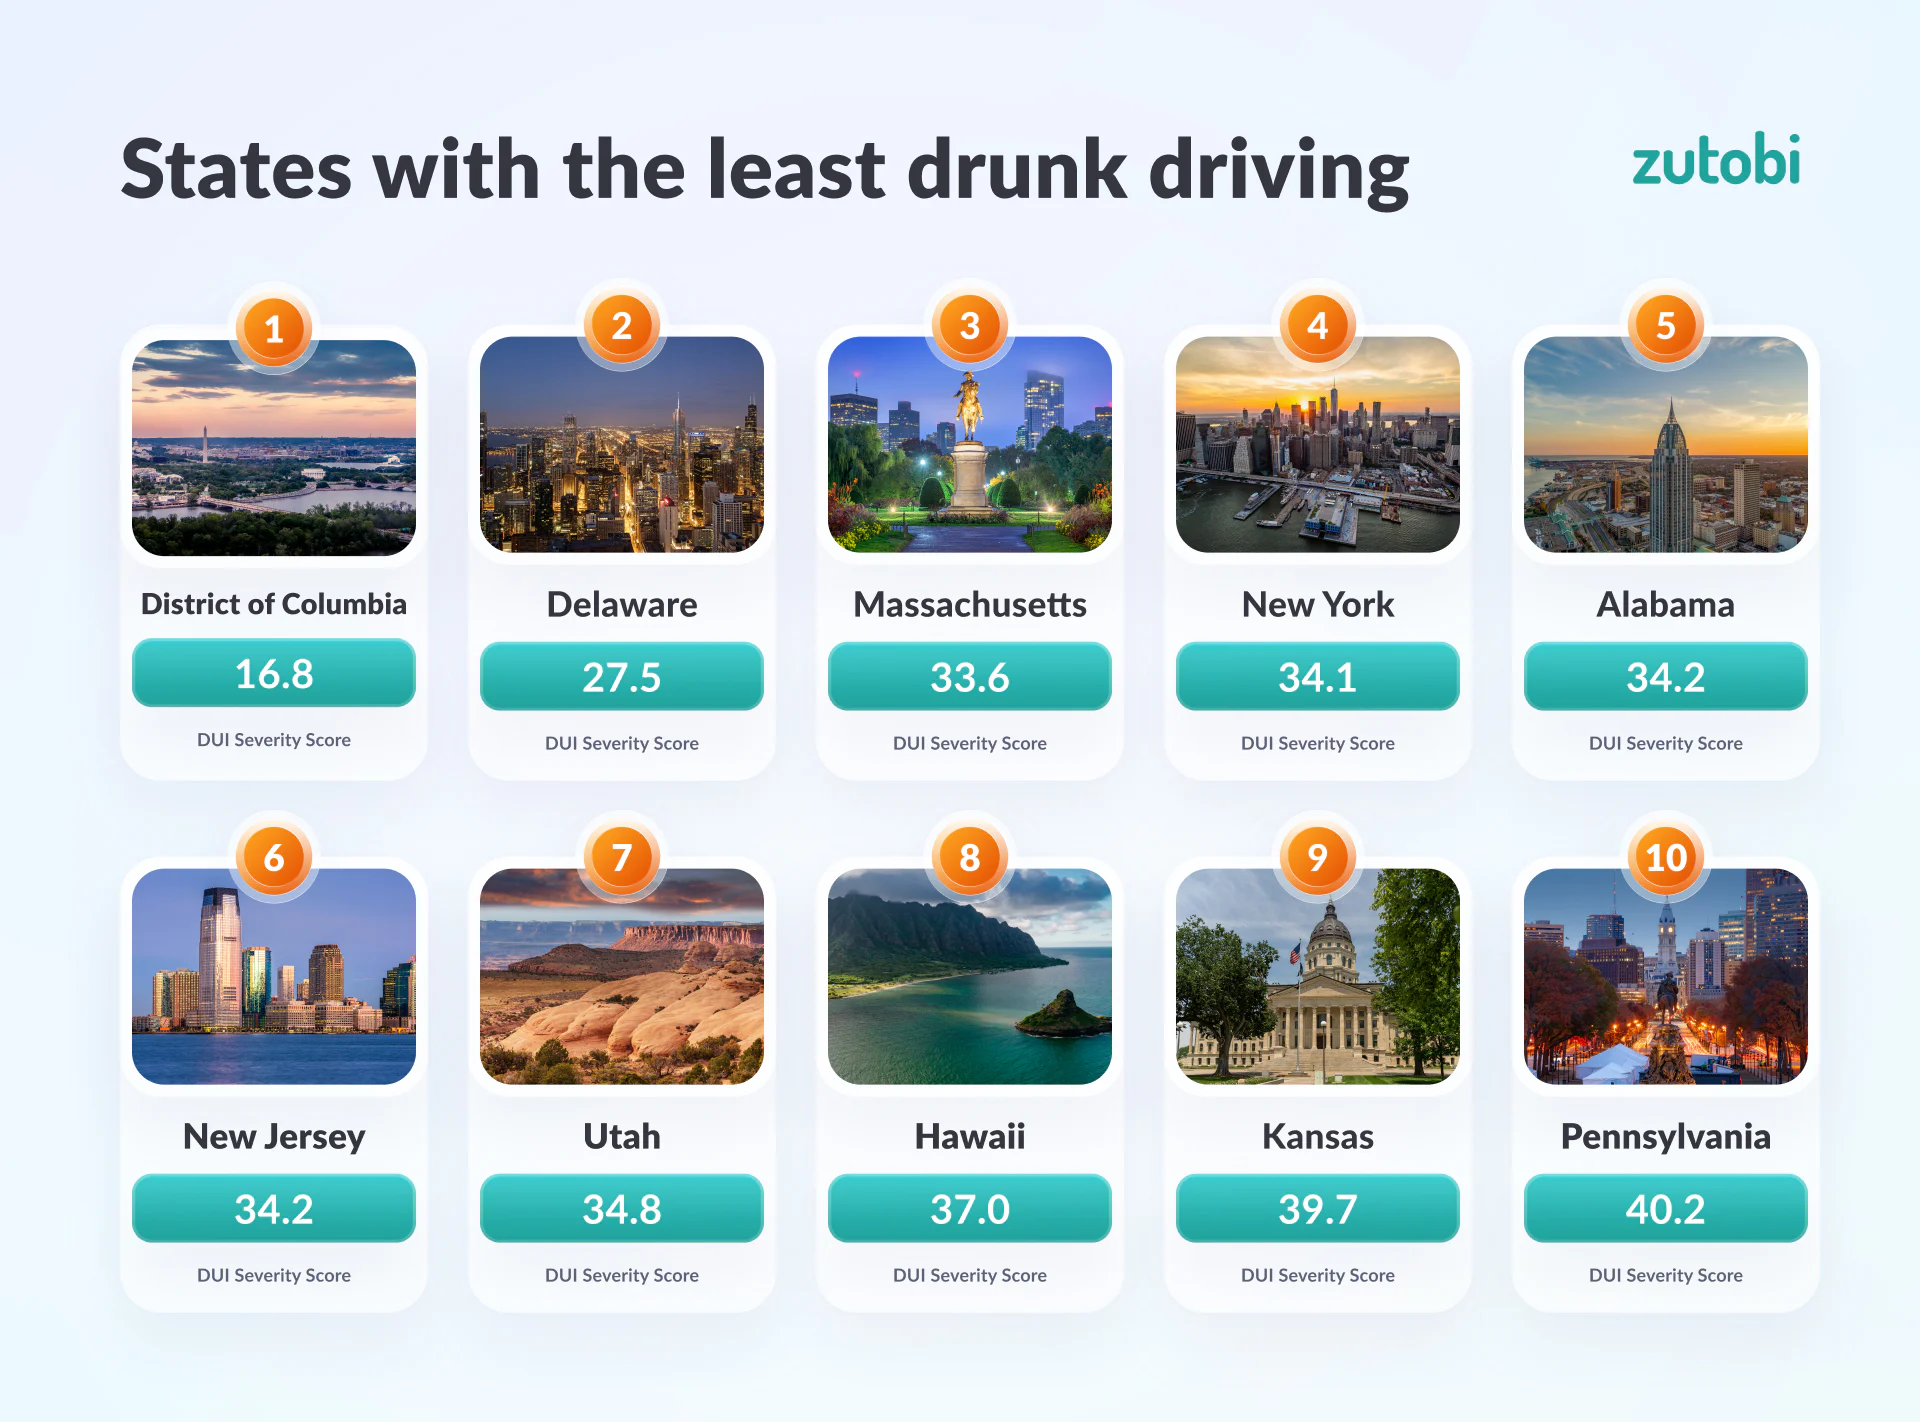
The District of Columbia recorded the lowest DUI severity score at 16.8 out of 100 in 2024. The District registered 3.32 DUI road fatalities per 100,000 drivers and 111.09 DUI arrests per 100,000 drivers, with alcohol-impaired crashes accounting for 29.8% of all road fatalities.
The top 10 states with the lowest DUI severity scores in 2024:
- District of Columbia (16.8): 3.32 DUI road fatalities per 100,000 drivers, 111.09 DUI arrests per 100,000 drivers, 29.8% of total fatalities, no change from 2023
- Delaware (27.5): 3.53 DUI road fatalities per 100,000 drivers, 37.58 DUI arrests per 100,000 drivers, 25.4% of total fatalities, 17.9% decrease from 2023
- Massachusetts (33.6): 2.01 DUI road fatalities per 100,000 drivers, 172.61 DUI arrests per 100,000 drivers, 27.5% of total fatalities, 13.8% decrease from 2023
- New York (34.1): 2.41 DUI road fatalities per 100,000 drivers, 133.57 DUI arrests per 100,000 drivers, 27.2% of total fatalities, 7.7% decrease from 2023
- Alabama (34.2): 7.27 DUI road fatalities per 100,000 drivers, 270.32 DUI arrests per 100,000 drivers, 28.8% of total fatalities, 2.1% decrease from 2023
- New Jersey (34.2): 2.16 DUI road fatalities per 100,000 drivers, 288.91 DUI arrests per 100,000 drivers, 22.4% of total fatalities, 5.6% increase from 2023
- Utah (34.8): 3.16 DUI road fatalities per 100,000 drivers, 422.14 DUI arrests per 100,000 drivers, 26.4% of total fatalities, 23.7% increase from 2023
- Hawaii (37.0): 3.54 DUI road fatalities per 100,000 drivers, 369.44 DUI arrests per 100,000 drivers, 33.3% of total fatalities, 12.8% decrease from 2023
- Kansas (39.7): 6.70 DUI road fatalities per 100,000 drivers, 480.62 DUI arrests per 100,000 drivers, 34.5% of total fatalities, 6.4% decrease from 2023
- Pennsylvania (40.2): 3.18 DUI road fatalities per 100,000 drivers, 412.58 DUI arrests per 100,000 drivers, 25.7% of total fatalities, 9.7% decrease from 2023
Key Findings and Notable Trends
Most Significant Improvements
Several states recorded the largest year over year drops in DUI fatalities:
- North Dakota: 28.9% decrease in DUI fatalities (from 38 to 27)
- Georgia: 24.9% decrease in DUI fatalities (from 433 to 325)
- Rhode Island: 20.8% decrease in DUI fatalities (from 24 to 19)
- Washington: 18.7% decrease in DUI fatalities (from 294 to 239)
States with Concerning Trends
Some states recorded the largest increases in DUI fatalities:
- West Virginia: 34.5% increase in DUI fatalities (from 58 to 78)
- Vermont: 33.3% increase in DUI fatalities (from 18 to 24)
- Maine: 32.4% increase in DUI fatalities (from 37 to 49)
- Oklahoma: 25.7% increase in DUI fatalities (from 179 to 225)
Age-Related Patterns
The 2024 figures show the percentage of drivers involved in fatal crashes who were alcohol-impaired, broken down by age group:
- Drivers aged 21 to 24 had the highest rate, at 27.9%.
- Drivers aged 25 to 34 followed at 26.6%.
- The rate was 23.1% for ages 35 to 44 and 20.3% for ages 16 to 20.
- It then declines with age, from 19.4% (45 to 54) down to 7.4% (over 74).
The complete list of drunk driving statistics by state
Below is the complete list of drunk driving statistics by state. Each state is ranked by its DUI Severity Score. We have also included the percentage change in DUI fatalities compared to the previous year, but this figure does not affect the Severity Score.
| States | DUI Arrests per 100,000 Drivers | DUI Road Fatalities per 100,000 Drivers | DUI Road Fatalities / Total Road Fatalities | DUI Severity Score | Change Percentage (%) |
|---|---|---|---|---|---|
| Montana | 531.73 | 8.5304 | 0.3641 | 83.60 | 5.63 |
| South Dakota | 929.40 | 6.1654 | 0.2945 | 82.20 | 13.16 |
| Wyoming | 719.61 | 7.5445 | 0.3178 | 79.90 | -5.56 |
| North Dakota | 915.82 | 4.5698 | 0.3000 | 77.40 | -28.95 |
| Maine | 422.16 | 4.5224 | 0.2768 | 65.60 | 32.43 |
| Texas | 335.54 | 8.5757 | 0.4029 | 64.70 | -1.35 |
| Wisconsin | 451.12 | 4.4031 | 0.3311 | 62.40 | 8.24 |
| Oregon | 477.60 | 5.5963 | 0.3309 | 62.00 | -11.00 |
| Missouri | 444.24 | 6.0693 | 0.2754 | 60.40 | -7.07 |
| New Mexico | 416.09 | 7.2954 | 0.2812 | 59.90 | -3.36 |
| South Carolina | 379.75 | 10.0435 | 0.4017 | 59.00 | 0.97 |
| Iowa | 415.95 | 4.9736 | 0.3343 | 55.60 | -15.60 |
| Idaho | 556.01 | 5.0842 | 0.3025 | 54.90 | 20.00 |
| Kentucky | 507.76 | 6.0903 | 0.2390 | 54.00 | -14.65 |
| Washington | 451.93 | 3.9455 | 0.3274 | 52.50 | -18.71 |
| Rhode Island | 404.80 | 2.4659 | 0.3654 | 52.00 | -20.83 |
| Tennessee | 431.86 | 6.4180 | 0.2774 | 51.70 | -10.51 |
| Oklahoma | 484.61 | 8.7721 | 0.3488 | 51.30 | 25.70 |
| Connecticut | 263.86 | 3.9846 | 0.3387 | 50.70 | -7.08 |
| Virginia | 314.73 | 4.2042 | 0.2748 | 50.60 | -3.45 |
| Vermont | 457.69 | 4.9749 | 0.4068 | 50.10 | 33.33 |
| New Hampshire | 443.60 | 3.5649 | 0.2932 | 49.40 | 8.33 |
| Maryland | 311.23 | 3.8557 | 0.2889 | 47.40 | -3.47 |
| Arkansas | 250.53 | 5.1864 | 0.2554 | 47.10 | -1.91 |
| California | 366.05 | 4.7132 | 0.3382 | 47.00 | -3.25 |
| Nevada | 559.73 | 5.9804 | 0.3309 | 46.90 | 14.05 |
| Colorado | 389.24 | 4.4999 | 0.2961 | 46.30 | -4.67 |
| Nebraska | 489.92 | 5.0473 | 0.2988 | 46.10 | 7.14 |
| Mississippi | 661.95 | 8.2137 | 0.2271 | 45.50 | 10.32 |
| Louisiana | 122.75 | 5.6113 | 0.2553 | 45.30 | -17.24 |
| Ohio | 318.90 | 4.9414 | 0.3665 | 45.20 | -6.81 |
| Illinois | 231.41 | 3.8411 | 0.2872 | 44.90 | -15.29 |
| West Virginia | 276.27 | 6.7957 | 0.3047 | 43.90 | 34.48 |
| Michigan | 280.00 | 3.9132 | 0.2787 | 43.00 | 6.99 |
| Minnesota | 564.53 | 2.5843 | 0.2285 | 42.80 | 9.00 |
| Indiana | 369.09 | 4.3398 | 0.2512 | 42.50 | -16.73 |
| Arizona | 407.44 | 7.1020 | 0.3409 | 42.20 | -2.33 |
| Alaska | 596.69 | 2.4082 | 0.1857 | 41.90 | -13.33 |
| North Carolina | 197.05 | 5.5085 | 0.2773 | 41.70 | 8.19 |
| Florida | 93.10 | 4.4872 | 0.2451 | 41.30 | -8.34 |
| Georgia | 287.92 | 4.1475 | 0.2316 | 40.90 | -24.94 |
| Pennsylvania | 412.58 | 3.1842 | 0.2573 | 40.20 | -9.66 |
| Kansas | 480.62 | 6.7039 | 0.3451 | 39.70 | -6.40 |
| Hawaii | 369.44 | 3.5422 | 0.3333 | 37.00 | -12.82 |
| Utah | 422.14 | 3.1642 | 0.2635 | 34.80 | 23.73 |
| Alabama | 270.32 | 7.2690 | 0.2879 | 34.20 | -2.12 |
| New Jersey | 288.91 | 2.1575 | 0.2239 | 34.20 | 5.63 |
| New York | 133.57 | 2.4117 | 0.2725 | 34.10 | -7.69 |
| Massachusetts | 172.61 | 2.0143 | 0.2755 | 33.60 | -13.79 |
| Delaware | 37.58 | 3.5265 | 0.2540 | 27.50 | -17.95 |
| District of Columbia | 111.09 | 3.3160 | 0.2979 | 16.80 | 0.00 |
Methodology
Alcohol-impaired crash data was found through the NHTSA crash data tool, the Fatality and Injury Reporting System Tool (FIRST), and NSC injury data.
We calculated the DUI Severity Score by first creating a normalized score out of ten on the factors “DUI arrests per 100,000 drivers”, “DUI road fatalities per 100,000 drivers”, and the “DUI road fatality ratio,” and then taking a final average score across all factors to find the overall score for each state.
Previous DUI reports
You can view the full 2020 DUI Report following this link.
You can view the full 2021 DUI Report following this link.
You can view the full 2022 DUI Report following this link.
You can view the full 2023 DUI Report following this link.

Take our full course with tests and theory
600+ exam-like questions and practice tests
Easy summarized DMV handbook
America’s #1 driver’s ed app with a 95.8% pass rate
Recommended articles




Ace your DMV test, guaranteed
Want to Be the Top School in Your Area?

- Simple & automated admin
- More time for teaching
- #1 learning materials for students
Start learning now
Resources
- Driver’s License Renewal
- How to Get Your US Driver’s License
- How to Prepare for Your Road Test
- How to Get a Driver’s Permit
- Behind-The-Wheel training
- Courses
- Blog
- FAQ
Show More


©2026 Zutobi AB, 4 Peddlers Row, Unit #103, Newark, DE 19702