loved by
15.1+ million
users
Distracted Driving Report – The States With the Least and Most Distracted Driving
In April 2026, the National Highway Traffic Safety Administration (NHTSA) released data for 2024 that illustrated traffic deaths due to distracted driving decreased by 2% compared to 2023, but still remains a significant problem on American roads.
Every year, thousands of drivers and passengers are fatally injured as a result of distracted driving. In 2024, roughly 3,208 people were killed in car crashes involving a distracted driver, marking a slight decrease from the 3,275 people who were fatally injured in the preceding year.
In this report, we’ve pulled together the latest numbers to identify the major causes of distracted driving, what the trends look like through recent years, and which states have the greatest distracted driving issues and the highest number of fatal road accidents. We’ve then ranked each state from best to worst.
What is distracted driving?
Distracted driving occurs when the operator of the vehicle is trying to do something else besides drive. Since the driver’s attention is divided, distracted driving will drastically boost the chance of a car accident or fatal crash.
The most common driver distractions include other passengers in the vehicle, using a cell phone, adjusting audio or climate controls, eating or drinking, smoking, and daydreaming.
Texting is the most alarming distraction. Sending or reading a text takes your eyes off the road for 5 seconds. At 55 mph, that’s like driving the length of an entire football field with your eyes closed.
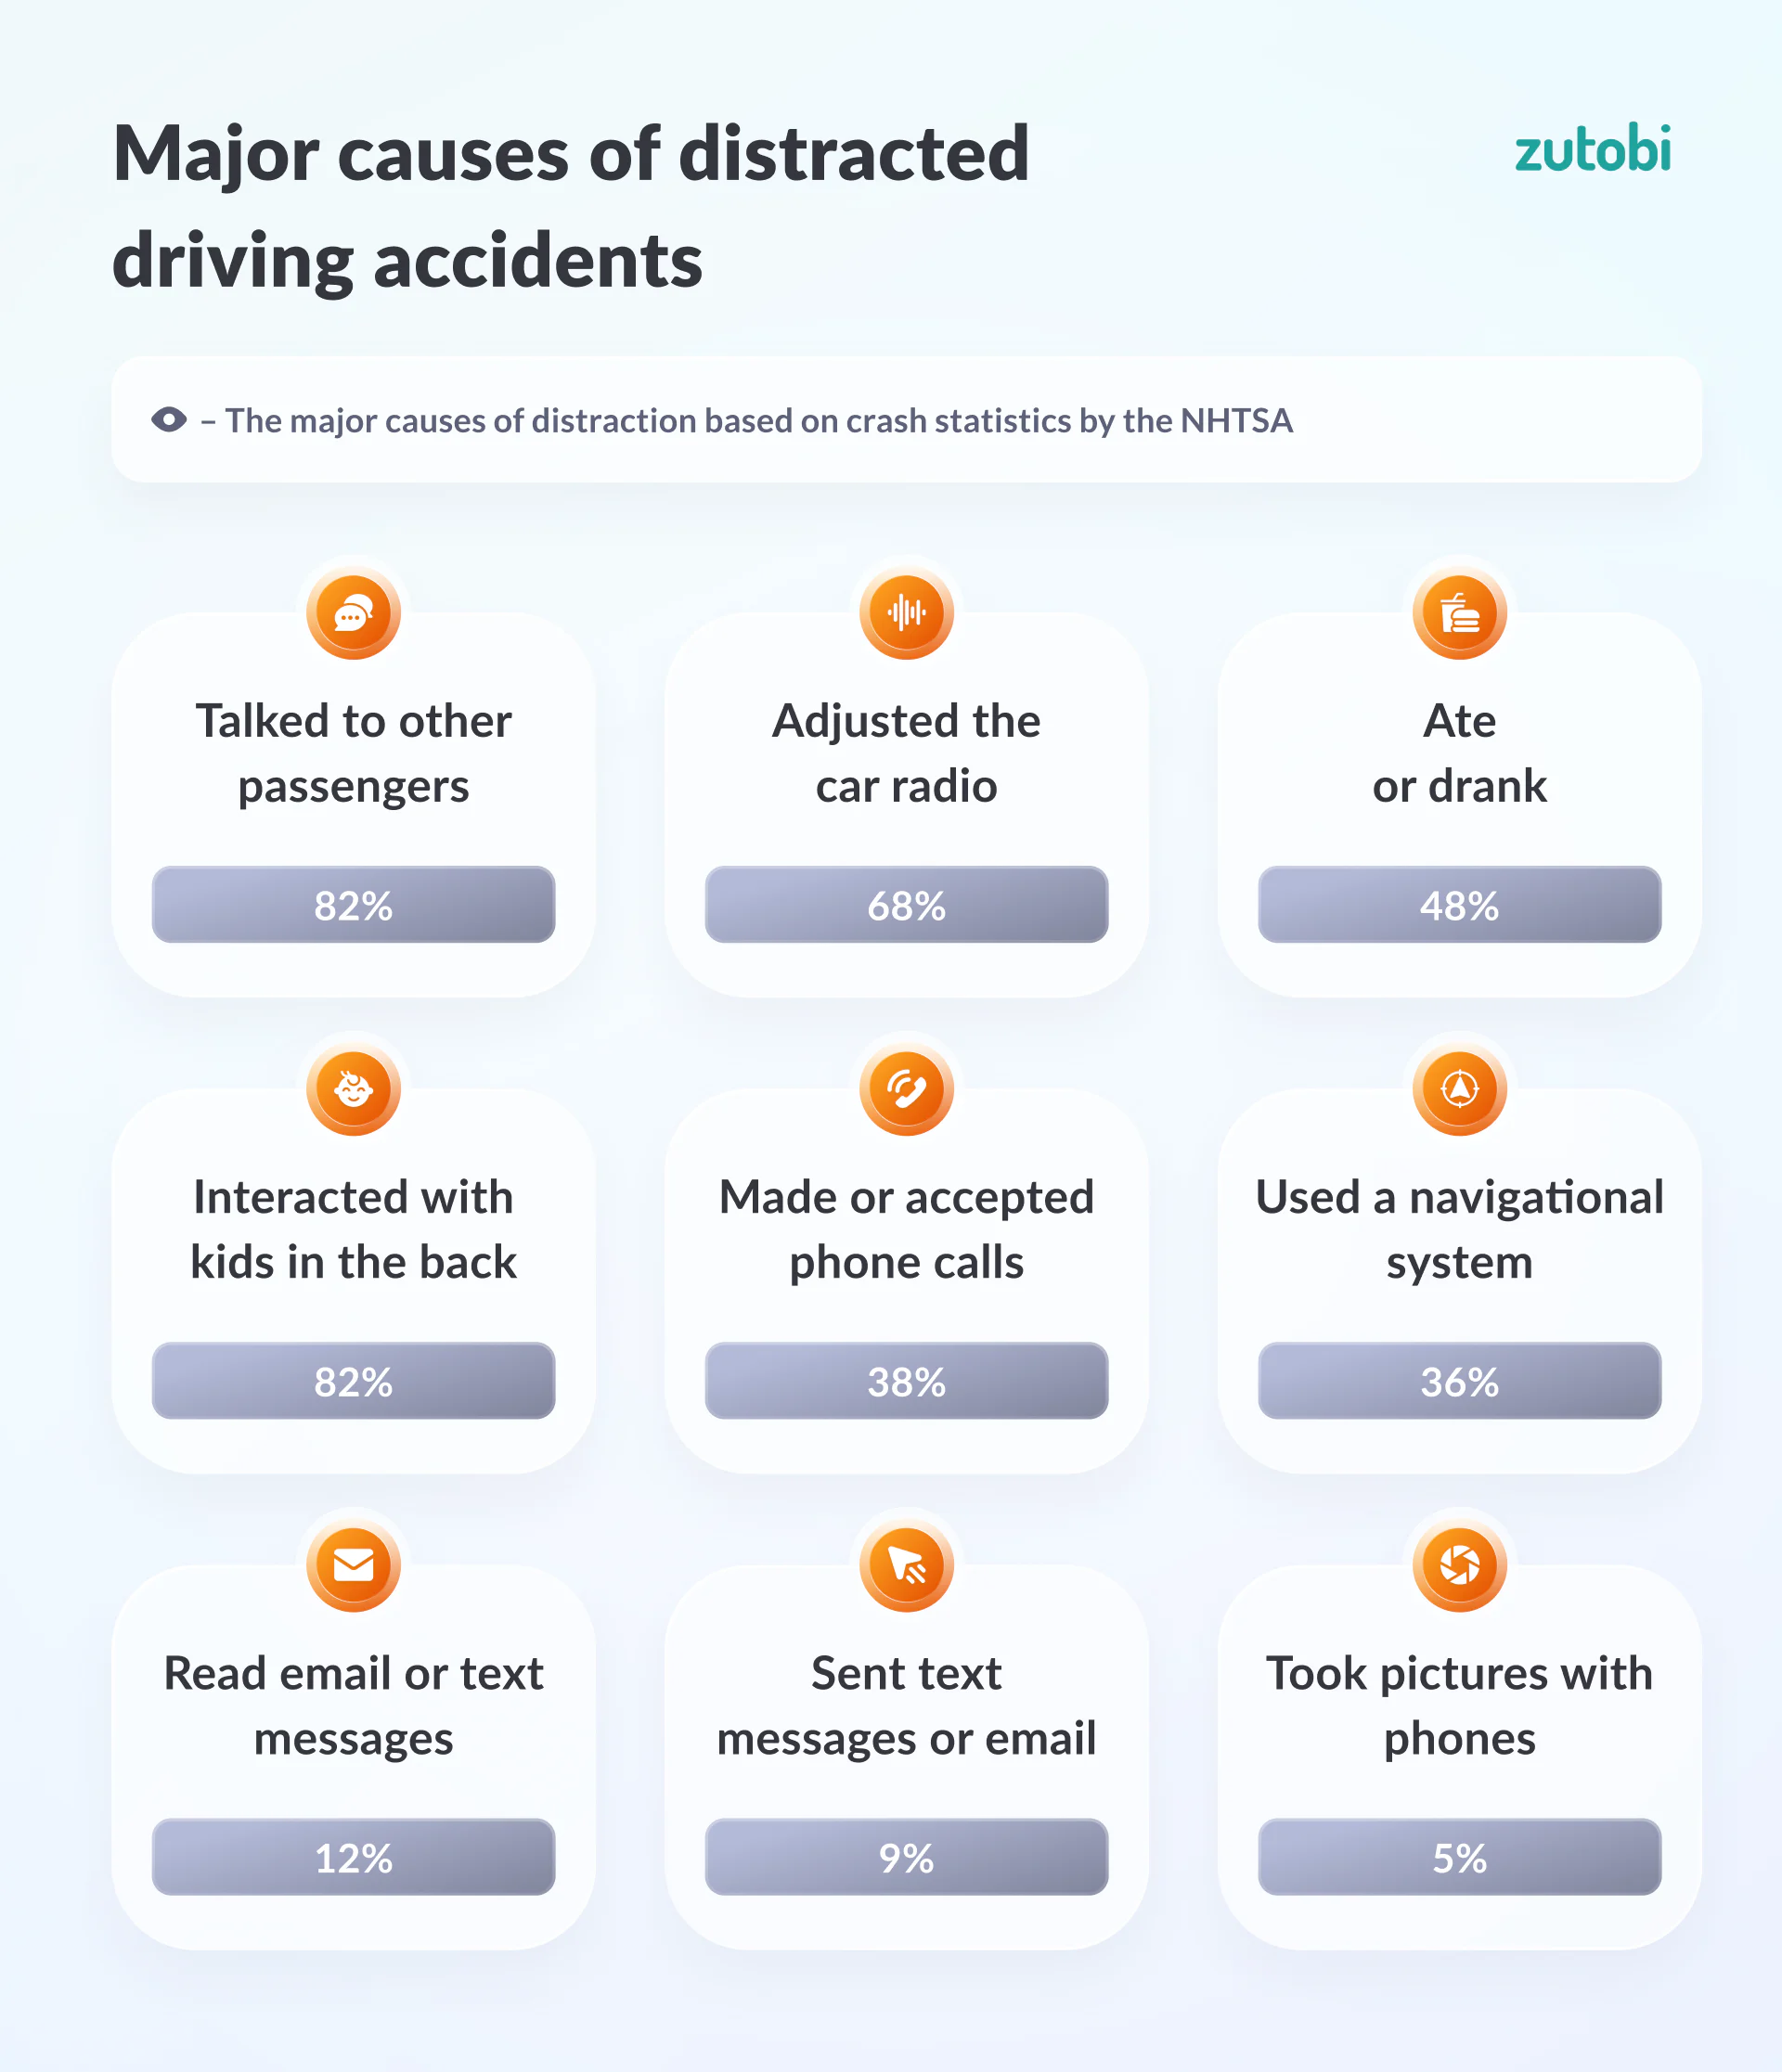
Recent surveys have identified the most common distracted driving behaviors:
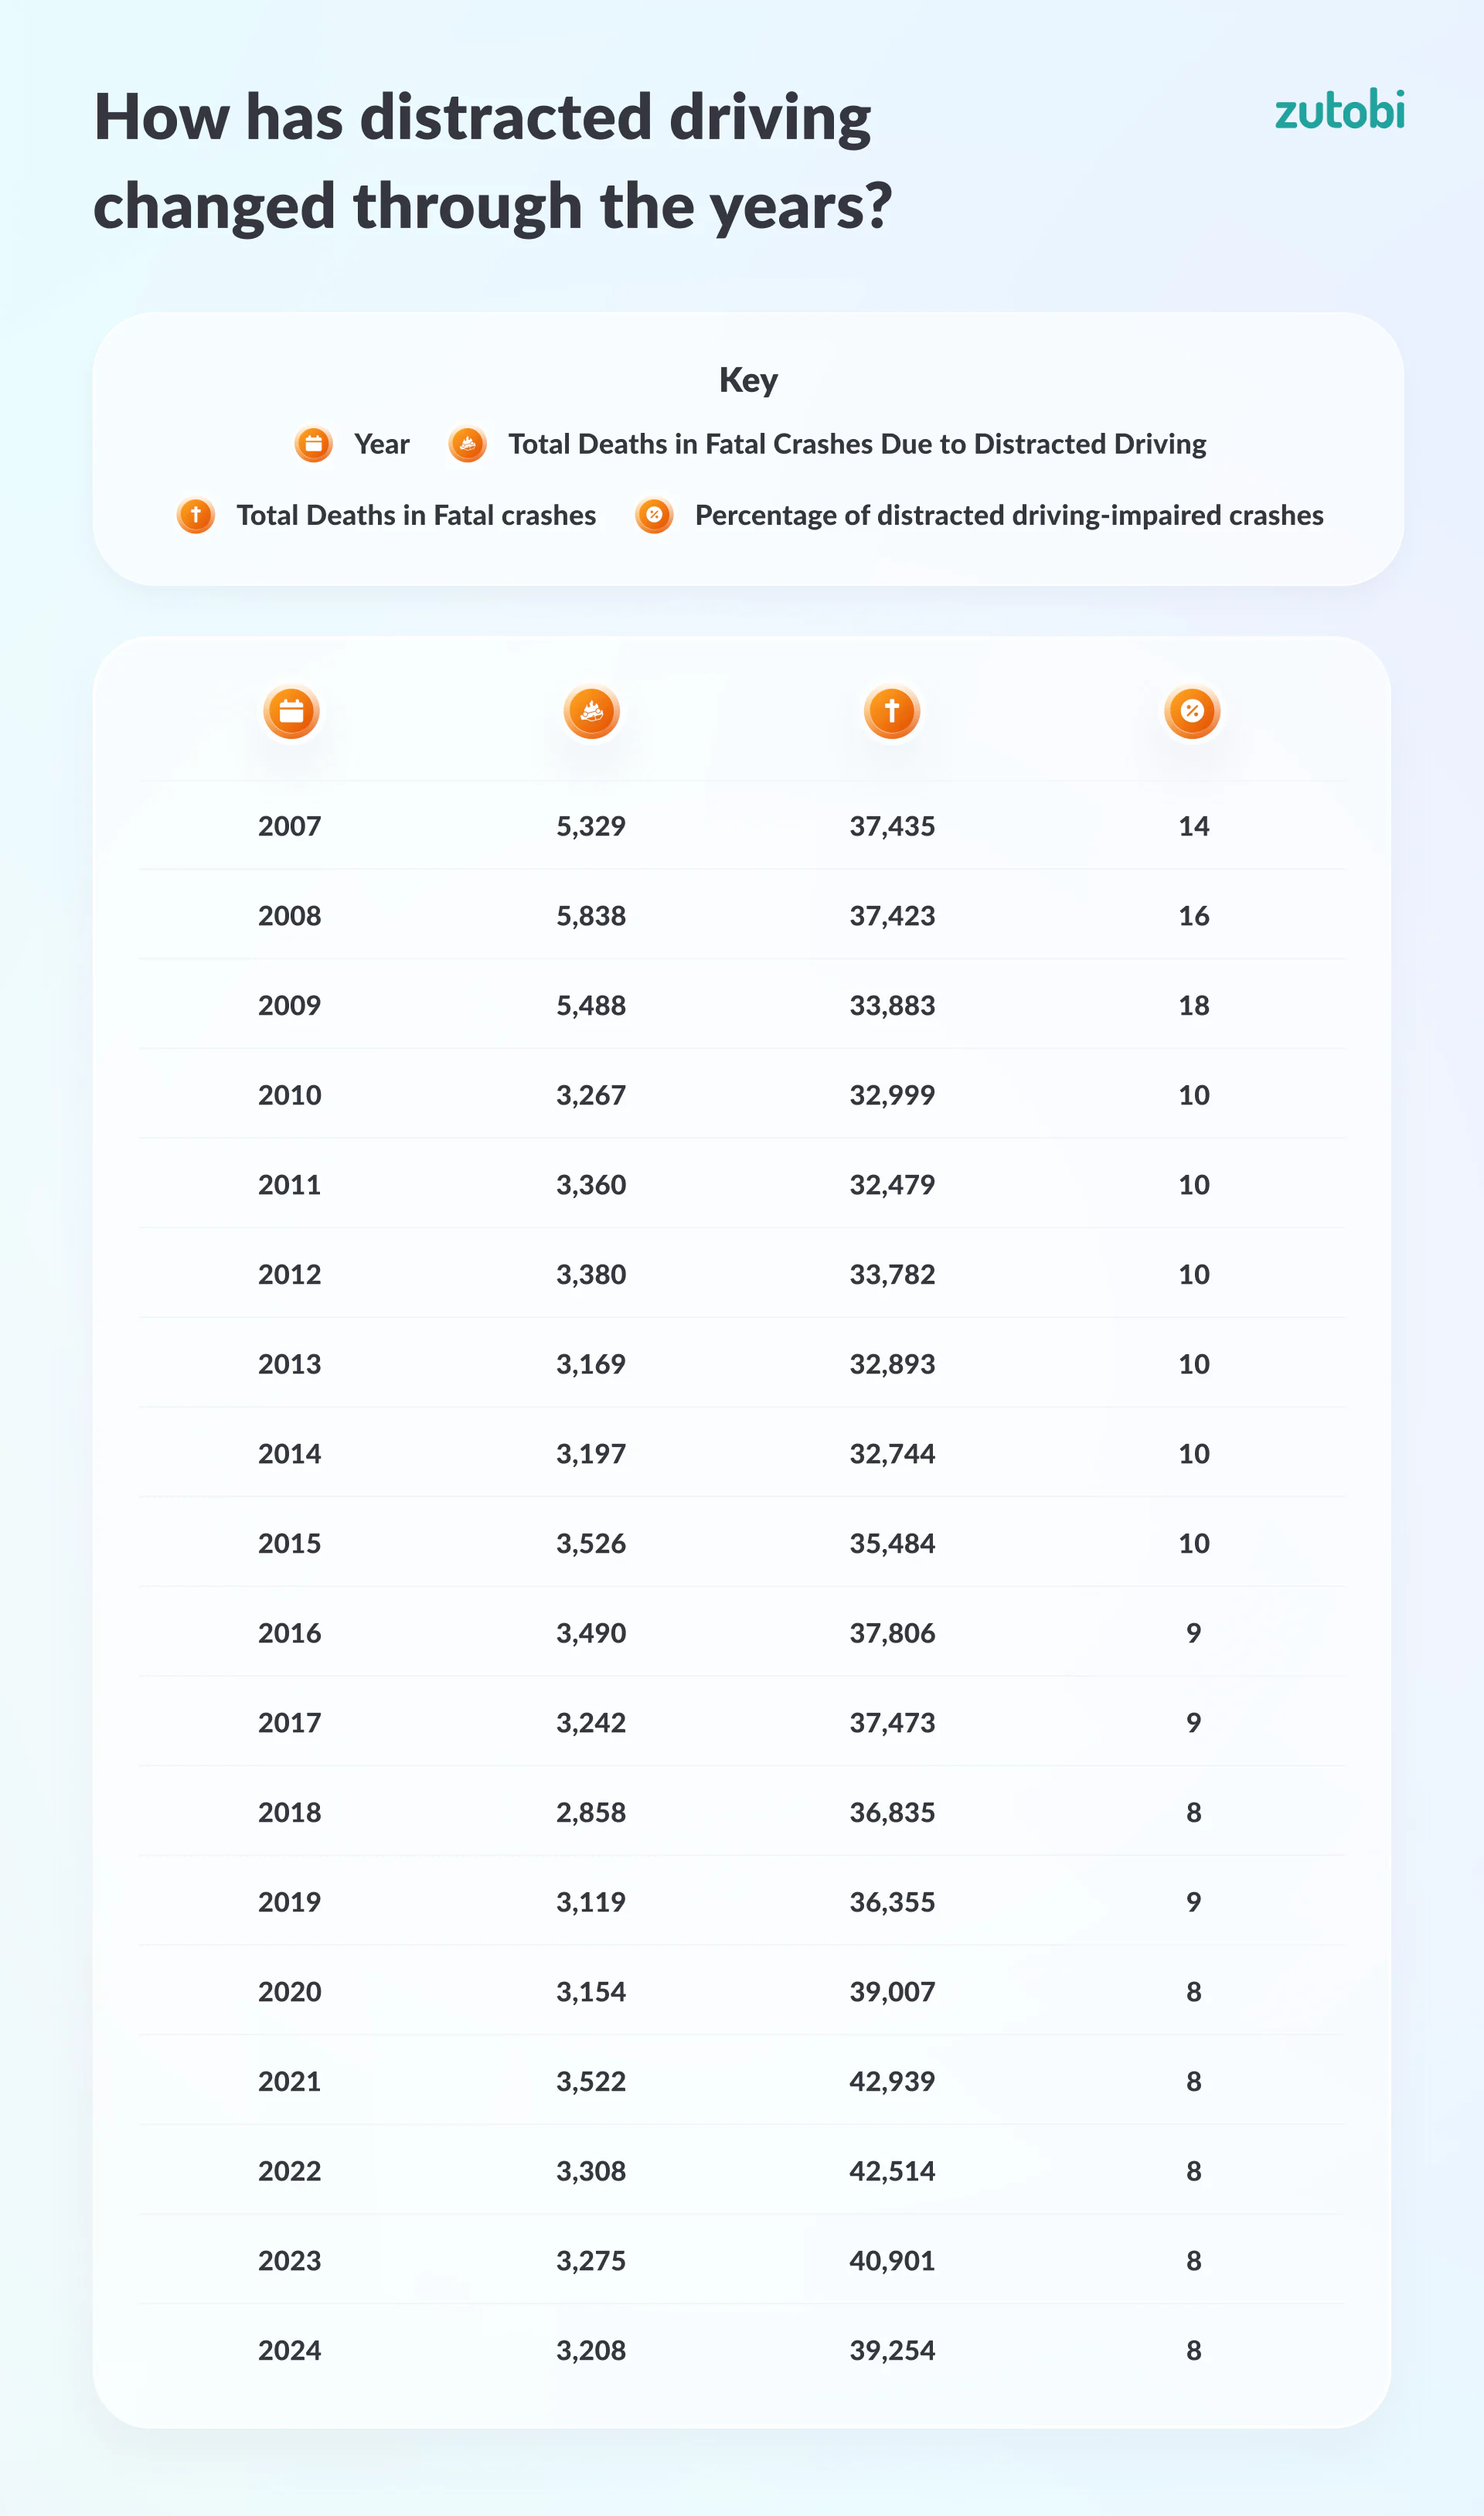
How has distracted driving changed through the years?
Distracted driving continues to be a significant reason for traffic accidents in the United States, making up 8.2 percent of total fatal crashes in 2024. During 2024, 3,208 people were killed in crashes involving a distracted driver, which represented a slight decrease from 3,275 deaths in 2023. During the last five years, roughly 16,467 people have been killed as a result of distracted driving.
Is there any difference between gender and age?
Men are nearly three times as likely to be involved in a fatal distracted driving accident compared to women. Male drivers were distracted in 4,418 fatal crashes in 2024, whereas women drivers were only distracted in 1,516 fatal crashes during the same period. Overall, male drivers account for 74.45% of all fatal distracted driving crashes — up from 72.41% in 2023, meaning the gender gap is widening year on year.
| State | Male Drivers Involved in Fatal Distracted Crashes | Female Drivers Involved in Fatal Distracted Crashes | Total | % |
|---|---|---|---|---|
| Alabama | 31 | 10 | 41 | 75.61 |
| Alaska | 2 | 1 | 3 | 66.67 |
| Arizona | 44 | 15 | 59 | 74.58 |
| Arkansas | 10 | 7 | 17 | 58.82 |
| California | 131 | 50 | 181 | 72.38 |
| Colorado | 34 | 9 | 43 | 79.07 |
| Connecticut | 6 | 3 | 9 | 66.67 |
| Delaware | 3 | 1 | 4 | 75.00 |
| District of Columbia | 0 | 0 | 0 | 0.00 |
| Florida | 177 | 57 | 234 | 75.64 |
| Georgia | 51 | 16 | 67 | 76.12 |
| Hawaii | 24 | 12 | 36 | 66.67 |
| Idaho | 40 | 8 | 48 | 83.33 |
| Illinois | 62 | 15 | 77 | 80.52 |
| Indiana | 22 | 7 | 29 | 75.86 |
| Iowa | 19 | 8 | 27 | 70.37 |
| Kansas | 59 | 17 | 76 | 77.63 |
| Kentucky | 91 | 44 | 135 | 67.41 |
| Louisiana | 160 | 55 | 215 | 74.42 |
| Maine | 11 | 2 | 13 | 84.62 |
| Maryland | 14 | 7 | 21 | 66.67 |
| Massachusetts | 24 | 10 | 34 | 70.59 |
| Michigan | 37 | 19 | 56 | 66.07 |
| Minnesota | 23 | 8 | 31 | 74.19 |
| Mississippi | 16 | 1 | 17 | 94.12 |
| Missouri | 66 | 19 | 85 | 77.65 |
| Montana | 7 | 4 | 11 | 63.64 |
| Nebraska | 8 | 4 | 12 | 66.67 |
| Nevada | 7 | 1 | 8 | 87.50 |
| New Hampshire | 4 | 0 | 4 | 100.00 |
| New Jersey | 163 | 47 | 210 | 77.62 |
| New Mexico | 112 | 23 | 135 | 82.96 |
| New York | 74 | 23 | 97 | 76.29 |
| North Carolina | 14 | 7 | 21 | 66.67 |
| North Dakota | 5 | 4 | 9 | 55.56 |
| Ohio | 32 | 9 | 41 | 78.05 |
| Oklahoma | 47 | 14 | 61 | 77.05 |
| Oregon | 22 | 13 | 35 | 62.86 |
| Pennsylvania | 24 | 10 | 34 | 70.59 |
| Rhode Island | 1 | 1 | 2 | 50.00 |
| South Carolina | 25 | 6 | 31 | 80.65 |
| South Dakota | 6 | 6 | 12 | 50.00 |
| Tennessee | 49 | 20 | 69 | 71.01 |
| Texas | 264 | 94 | 358 | 73.74 |
| Utah | 15 | 2 | 17 | 88.24 |
| Vermont | 5 | 0 | 5 | 0.00 |
| Virginia | 42 | 22 | 64 | 65.63 |
| Washington | 84 | 37 | 121 | 69.42 |
| West Virginia | 4 | 3 | 7 | 57.14 |
| Wisconsin | 32 | 7 | 39 | 82.05 |
| Wyoming | 6 | 0 | 6 | 100.00 |
| Total | 2209 | 758 | 2967 | 74.45 |
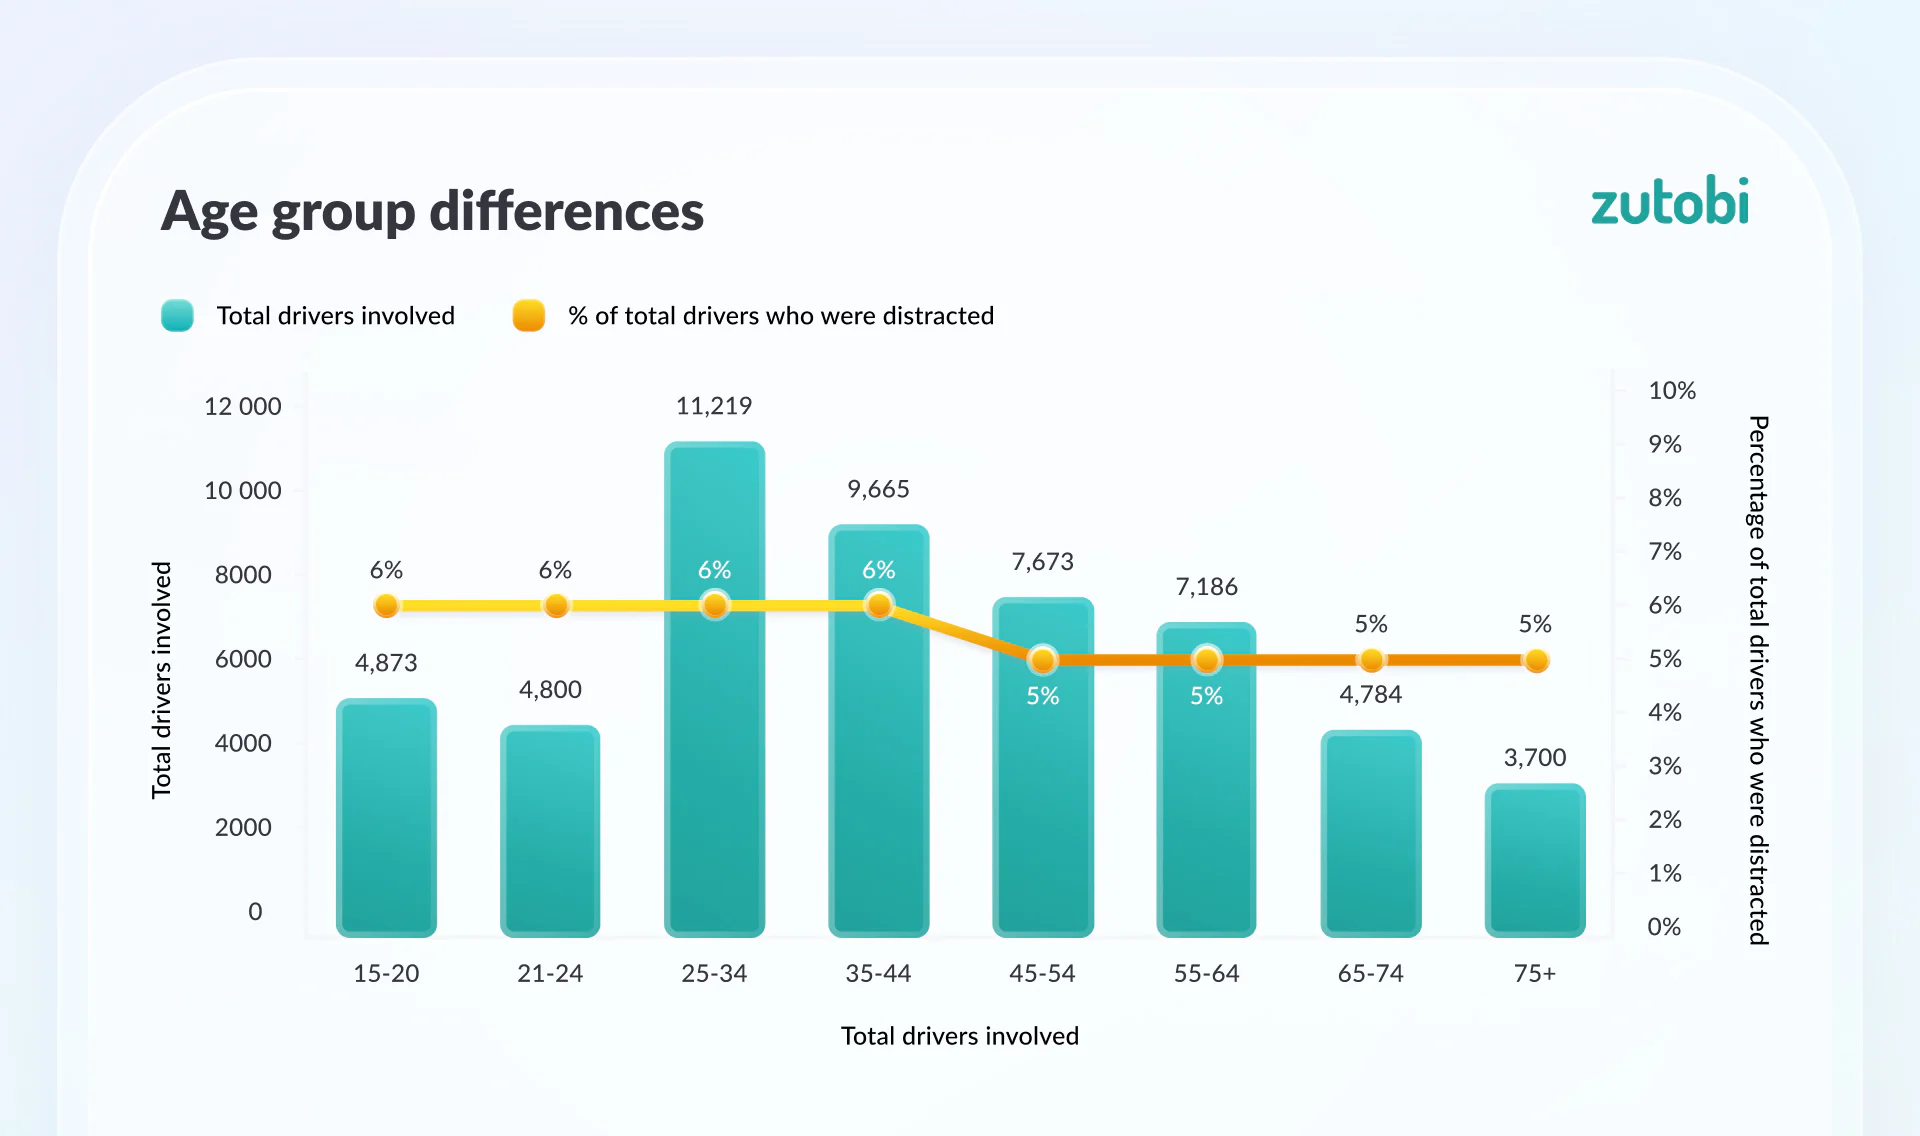
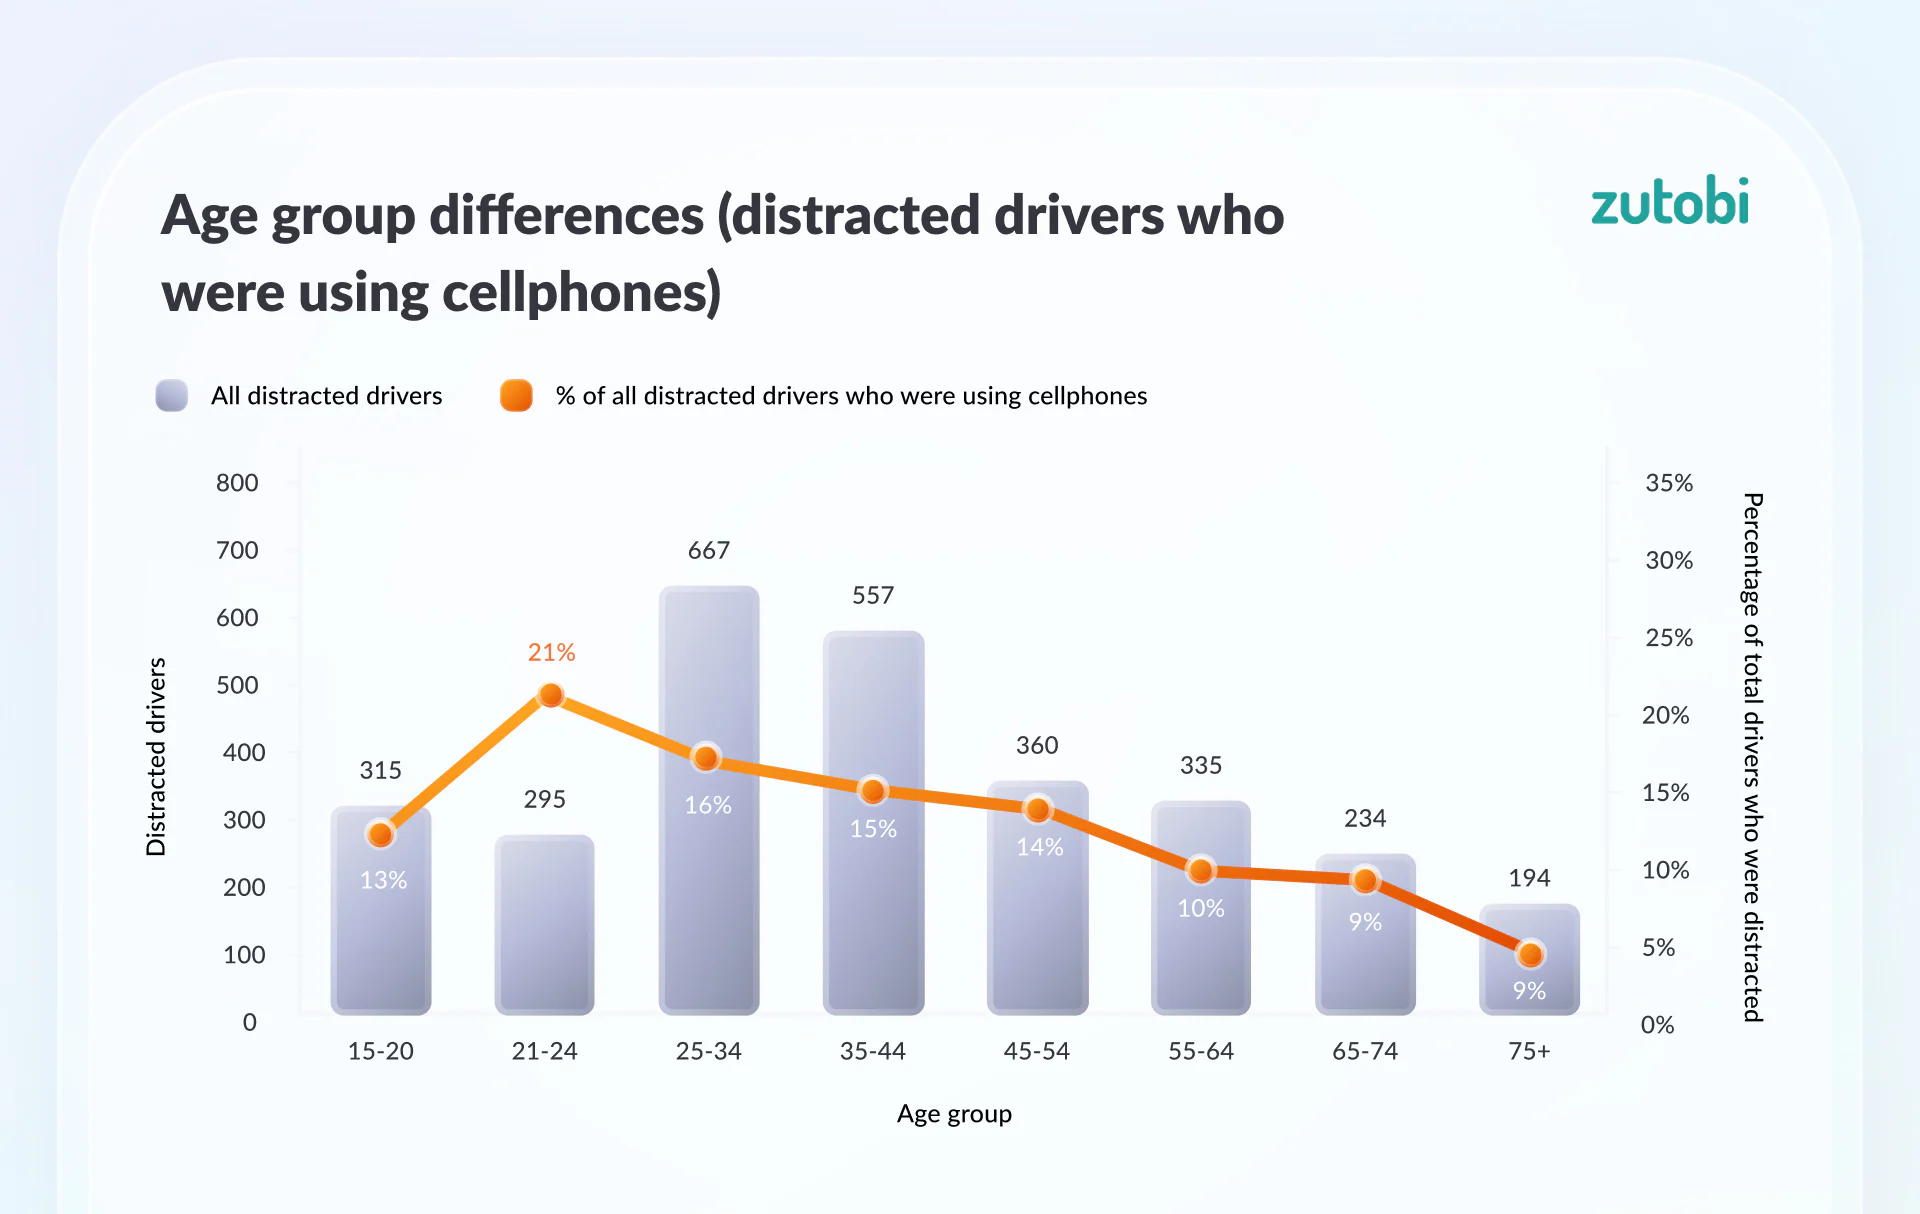
Age Group Differences
Age plays a significant role in distracted driving behavior, though the data reveals a more nuanced picture than is often reported. According to the latest NHTSA data, drivers between the ages of 15 and 44 show a distraction rate of 6% — meaning 6% of all drivers in that age group involved in a fatal crash were distracted. Among drivers aged 45 and above, that figure drops to 5%.
The gap between the youngest and oldest drivers is smaller than headlines typically suggest. However, because the 25–34 and 35–44 age groups account for the highest total number of drivers involved in crashes — 11,219 and 9,665 respectively — middle-aged drivers make up the largest share of distracted driving fatalities in absolute terms. The public conversation tends to focus on teenagers, but the numbers tell a more complicated story.
When it comes to cellphone use specifically, the picture shifts sharply by age. Drivers aged 21–24 are the most likely to be on their phone at the time of a fatal crash, with 21% of all distracted drivers in that age group confirmed to be using a cellphone. That figure drops steadily with age — 16% among 25–34 year olds, 15% among 35–44 year olds, and just 5% among drivers aged 75 and older. Notably, teenage drivers (15–20) show a cellphone rate of 13% — lower than the 21–24 group — suggesting that the most dangerous years for phone-related distraction may come not during the learner stage, but just after young drivers first gain full independence behind the wheel.
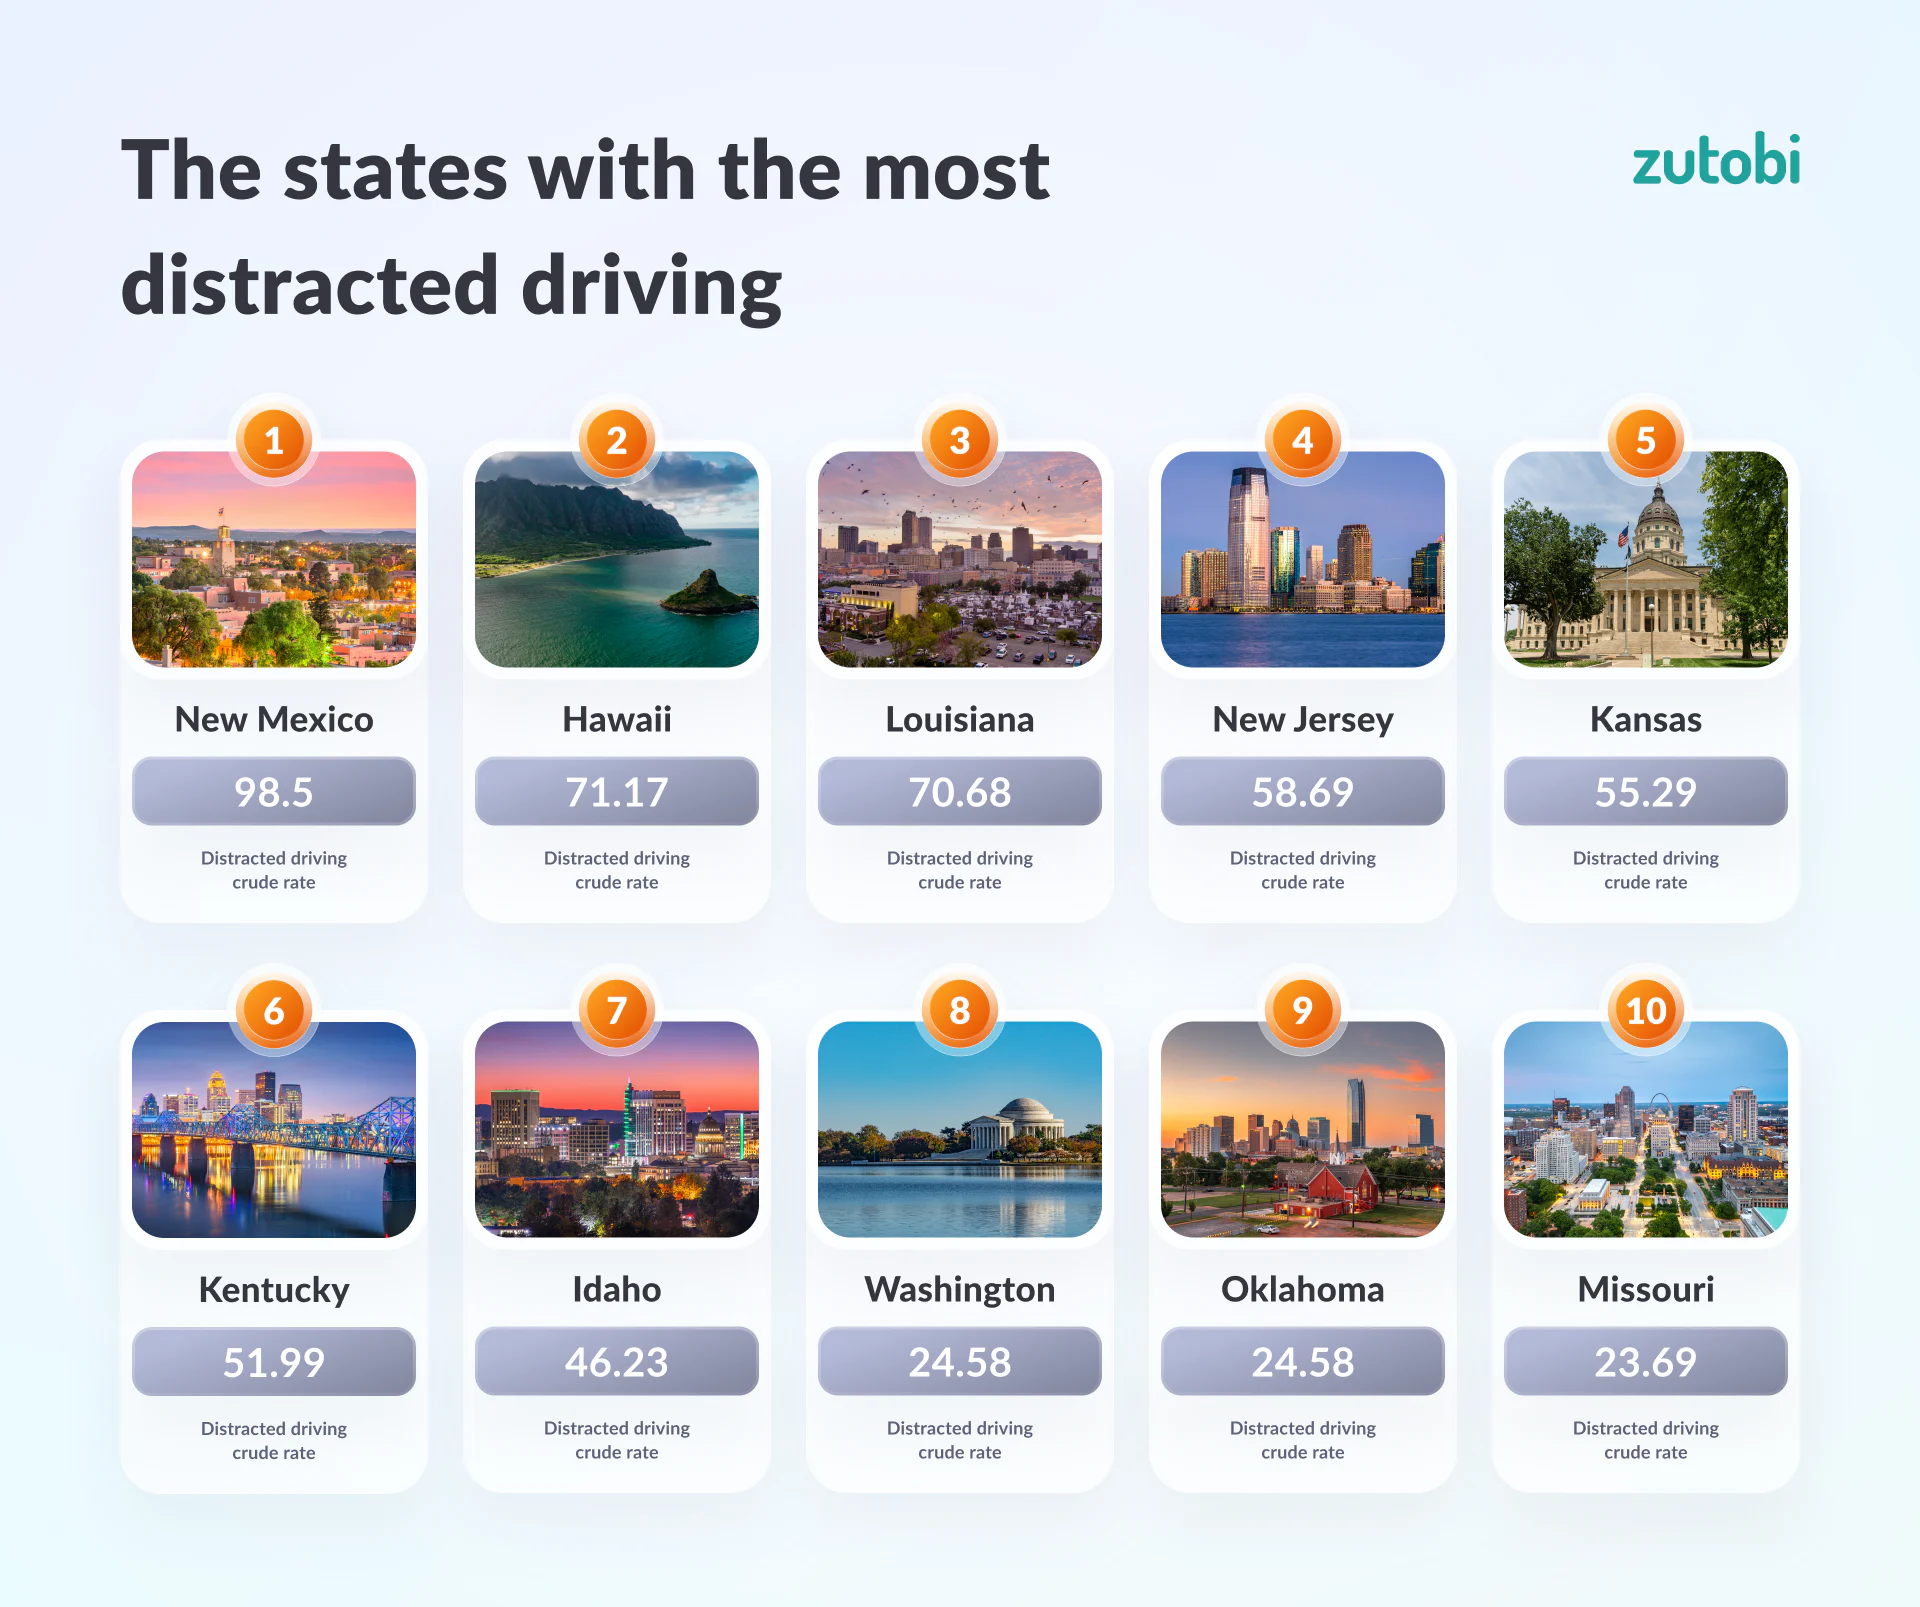
States with the most distracted driving
For the fifth year in a row, New Mexico has the most distracted driving in the country. According to statistics by NHTSA, New Mexico reported 159 distracted driving deaths in 2024. The state reported 10.09 distracted driving deaths for every 100,000 drivers, and 37.04 percent of all fatal crashes in the state were due to distracted driving.
The second worst state is Hawaii — which also recorded the largest single-year deterioration of any state, with distracted driving deaths jumping from 25 to 41. Louisiana follows in third, with New Jersey, Kansas, Kentucky, Idaho, Washington, Oklahoma, and Missouri rounding out the top ten.
States with the least distracted driving
The District of Columbia had zero deaths in fatal crashes due to distracted driving. This perfect performer was followed by North Carolina, Nevada, Connecticut, Pennsylvania, New Hampshire, Delaware, Rhode Island, Arkansas, and West Virginia.
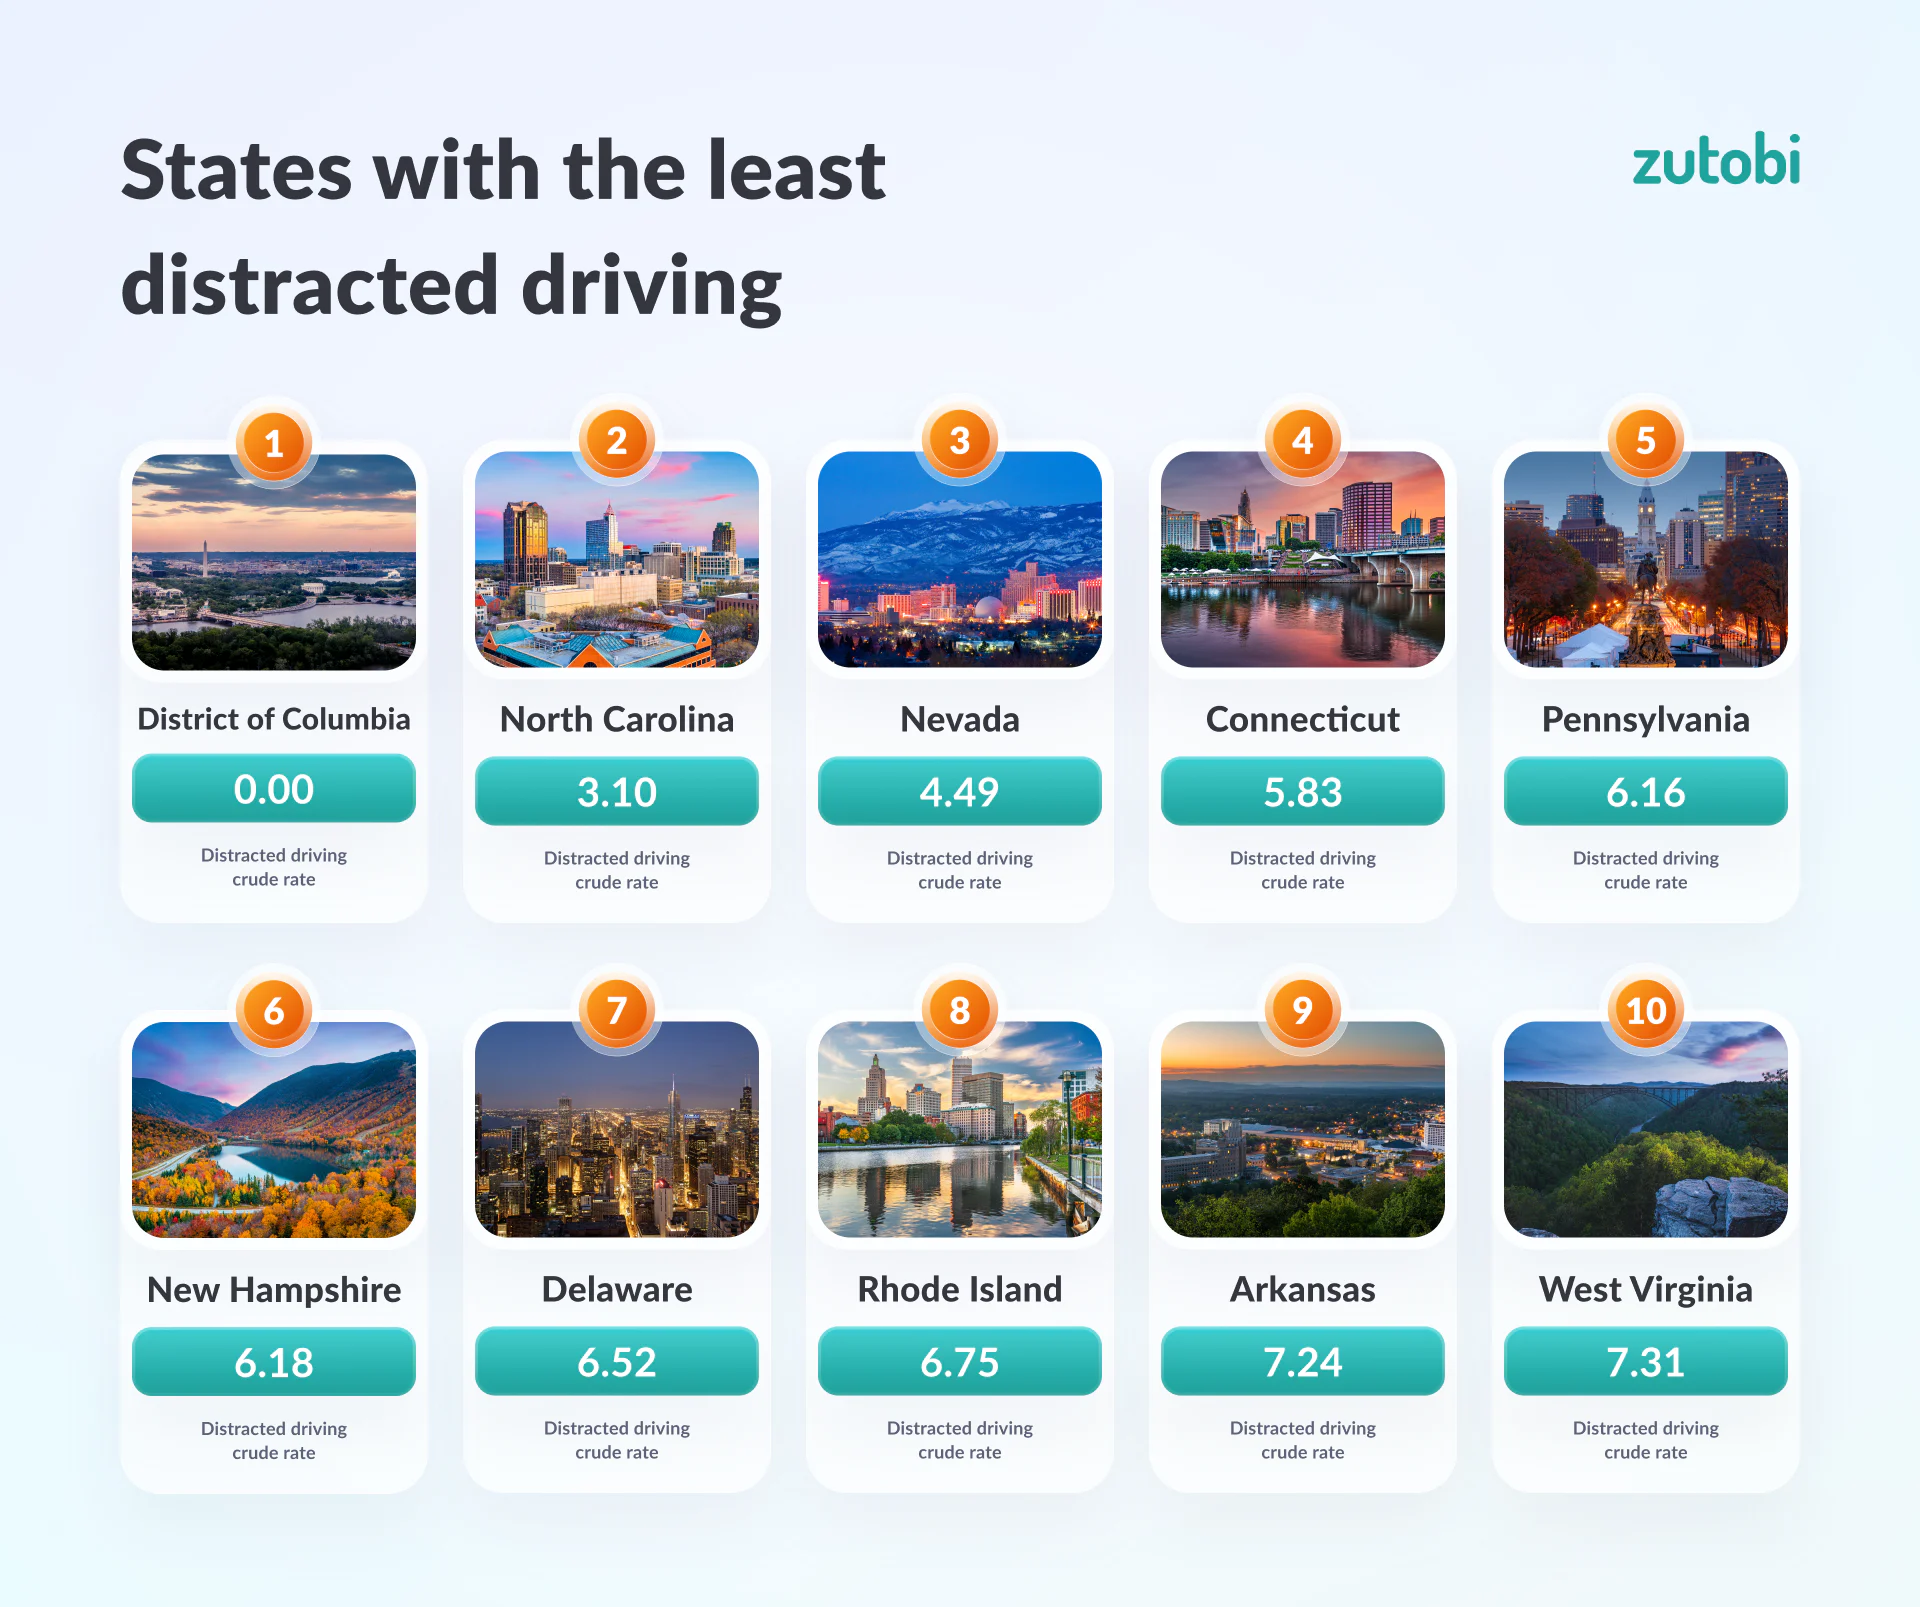
The large difference in distracted driving crashes could, in part, be attributed to different state guidelines on reporting distracted driving accidents. It can also be a result of extensive work by local governments on tackling distracted driving through anti-texting laws, awareness campaigns, and more.
States with the most distracted driving
| State | Total Deaths in Fatal crashes Due to Distracted driving | Distracted Driving Deaths per 100 000 licensed drivers | Percentage of Fatal Crashes Involving Distracted Driving | Distracted Driving Crude |
|---|---|---|---|---|
| New Mexico | 159 | 10.09 | 37.04% | 98.5 |
| Hawaii | 41 | 4.27 | 38.14% | 71.17 |
| Louisiana | 221 | 6.46 | 29.50% | 70.68 |
| New Jersey | 221 | 3.18 | 32.76% | 58.69 |
| Kansas | 83 | 4.76 | 24.20% | 55.29 |
| Kentucky | 145 | 5.23 | 19.91% | 51.99 |
| Idaho | 50 | 3.53 | 21.92% | 46.23 |
| Washington | 138 | 2.28 | 19.14% | 36.38 |
| Oklahoma | 61 | 2.38 | 9.76% | 24.58 |
| Missouri | 98 | 2.26 | 9.52% | 23.69 |
| North Dakota | 10 | 1.69 | 10.71% | 22.43 |
| Texas | 387 | 1.98 | 9.54% | 22.32 |
| South Dakota | 12 | 1.72 | 8.21% | 19.29 |
| Vermont | 5 | 1.04 | 9.43% | 17.50 |
| Florida | 241 | 1.41 | 7.81% | 17.21 |
| Iowa | 29 | 1.21 | 8.33% | 16.93 |
| New York | 105 | 0.84 | 9.65% | 16.84 |
| Massachusetts | 36 | 0.73 | 9.74% | 16.36 |
| Maine | 14 | 1.29 | 7.19% | 15.82 |
| Tennessee | 76 | 1.47 | 6.22% | 15.44 |
| Wyoming | 7 | 1.55 | 5.88% | 15.41 |
| Virginia | 68 | 1.13 | 7.38% | 15.30 |
| Oregon | 38 | 1.19 | 7.13% | 15.26 |
| Wisconsin | 47 | 1.05 | 7.18% | 14.62 |
| Colorado | 51 | 1.12 | 6.70% | 14.35 |
| Arizona | 75 | 1.27 | 5.46% | 13.45 |
| Minnesota | 33 | 0.78 | 7.19% | 13.31 |
| Utah | 19 | 0.82 | 6.77% | 12.96 |
| Montana | 10 | 1.14 | 5.18% | 12.43 |
| Illinois | 74 | 0.84 | 5.99% | 12.02 |
| Nebraska | 14 | 0.94 | 5.38% | 11.72 |
| Alabama | 43 | 1.13 | 4.58% | 11.60 |
| Georgia | 71 | 0.91 | 5.11% | 11.18 |
| Michigan | 64 | 0.82 | 5.34% | 11.06 |
| California | 200 | 0.72 | 5.19% | 10.37 |
| Alaska | 3 | 0.56 | 4.76% | 9.00 |
| Indiana | 31 | 0.64 | 3.82% | 8.20 |
| South Carolina | 31 | 0.75 | 3.27% | 7.99 |
| Maryland | 24 | 0.55 | 3.80% | 7.73 |
| Mississippi | 18 | 0.86 | 2.51% | 7.57 |
| Ohio | 44 | 0.51 | 3.81% | 7.53 |
| West Virginia | 8 | 0.70 | 2.94% | 7.31 |
| Arkansas | 19 | 0.64 | 3.11% | 7.24 |
| Rhode Island | 2 | 0.26 | 4.17% | 6.75 |
| Delaware | 4 | 0.44 | 3.31% | 6.52 |
| New Hampshire | 4 | 0.37 | 3.33% | 6.18 |
| Pennsylvania | 36 | 0.40 | 3.21% | 6.16 |
| Connecticut | 9 | 0.34 | 3.16% | 5.83 |
| Nevada | 8 | 0.35 | 2.12% | 4.49 |
| North Carolina | 21 | 0.26 | 1.39% | 3.10 |
| District of Columbia | 0 | 0.00 | 0.00% | 0.00 |
States with the most improved distracted driving
Ten states recorded meaningful reductions across all key distracted driving metrics between 2023 and 2024. Pennsylvania leads the way, cutting deaths from 66 to 36 — a reduction of nearly 46% in a single year, with deaths per 100,000 licensed drivers falling from 0.72 to 0.40. Maryland and Oregon followed closely, each reducing total deaths by more than 40%.
Illinois made the most significant improvement in absolute terms, with 48 fewer deaths recorded in 2024 compared to the year prior. Wyoming and Montana, while smaller states, each reduced deaths by more than 40% and saw consistent improvement across every metric.
The large difference in distracted driving improvements could, in part, be attributed to the extensive work by local governments on tackling distracted driving through anti-texting laws, awareness campaigns, and stricter enforcement.
| # | State | Total deaths 2023 | Total deaths 2024 | Change in deaths | Deaths per 100k drivers 2023 | Deaths per 100k drivers 2024 | % of fatal crashes 2023 | % of fatal crashes 2024 |
|---|---|---|---|---|---|---|---|---|
| 1 | Pennsylvania | 66 | 36 | −45.5% | 0.72 | 0.40 | 5.74% | 3.21% |
| 2 | Maryland | 42 | 24 | −42.9% | 0.97 | 0.55 | 6.93% | 3.80% |
| 3 | New Hampshire | 7 | 4 | −42.9% | 0.64 | 0.37 | 5.74% | 3.33% |
| 4 | Wyoming | 12 | 7 | −41.7% | 2.72 | 1.55 | 9.92% | 5.88% |
| 5 | Montana | 17 | 10 | −41.2% | 1.93 | 1.14 | 8.67% | 5.18% |
| 6 | Illinois | 122 | 74 | −39.3% | 1.41 | 0.84 | 10.06% | 5.99% |
| 7 | Oregon | 67 | 38 | −43.3% | 2.13 | 1.19 | 9.55% | 7.13% |
| 8 | Indiana | 50 | 31 | −38.0% | 1.06 | 0.64 | 5.58% | 3.82% |
| 9 | Vermont | 8 | 5 | −37.5% | 1.67 | 1.04 | 11.11% | 9.43% |
| 10 | Maine | 17 | 14 | −17.6% | 1.60 | 1.29 | 13.39% | 7.19 |
States heading in the wrong direction
While the national picture shows modest improvement, not every state is moving in the right direction. Ten states recorded higher numbers across all three distracted driving metrics in 2024 compared to 2023.
Iowa and Georgia saw the most dramatic deterioration overall, with both states recording more than 60% more deaths and nearly doubling the share of fatal crashes attributable to distracted driving. Wisconsin saw deaths rise from 27 to 47 — a 74% increase — the largest single-year jump of any state in absolute percentage terms.
Hawaii recorded the steepest rise among states that were already struggling, with deaths climbing from 25 to 41 and the share of fatal crashes involving a distracted driver increasing from 28.41% to 38.14%. California saw 42 additional deaths in 2024, bringing its total to 200 — the second highest absolute increase of any state.
The large difference in distracted driving crashes could, in part, be attributed to different state guidelines on reporting distracted driving accidents. It can also be a result of reduced enforcement activity or gaps in local distracted driving legislation.
| # | State | Total deaths 2023 | Total deaths 2024 | Change in deaths | Deaths per 100k drivers 2023 | Deaths per 100k drivers 2024 | % of fatal crashes 2023 | % of fatal crashes 2024 |
|---|---|---|---|---|---|---|---|---|
| 1 | Iowa | 18 | 29 | +61.1% | 0.76 | 1.21 | 4.27% | 8.33% |
| 2 | Georgia | 44 | 71 | +61.4% | 0.57 | 0.91 | 2.62% | 5.11% |
| 3 | Wisconsin | 27 | 47 | +74.1% | 0.61 | 1.05 | 4.91% | 7.18% |
| 4 | Hawaii | 25 | 41 | +64.0% | 2.65 | 4.27 | 28.41% | 38.14% |
| 5 | Idaho | 40 | 50 | +25.0% | 2.86 | 3.53 | 14.88% | 21.92% |
| 6 | California | 158 | 200 | +26.6% | 0.57 | 0.72 | 3.76% | 5.19% |
| 7 | Nebraska | 10 | 14 | +40.0% | 0.69 | 0.94 | 4.85% | 5.38% |
| 8 | Mississippi | 14 | 18 | +28.6% | 0.68 | 0.86 | 1.95% | 2.51% |
| 9 | West Virginia | 6 | 8 | +33.3% | 0.53 | 0.70 | 2.58% | 2.94% |
| 10 | Virginia | 53 | 68 | +28.3% | 0.90 | 1.13 | 6.08% |
The complete list of distracted driving statistics for each state
2023 Distracted Driving Report
2024 Distracted Driving Report
2025 Disctracted Driving Report
Methodology
The data in this report has beenarious gathered from various governmental websites, including the Fatality and Injury Reporting System Tool (FIRST) developed by NHTSA.

Take our full course with tests and theory
600+ exam-like questions and practice tests
Easy summarized DMV handbook
America’s #1 driver’s ed app with a 95.8% pass rate
Recommended articles


Ace your DMV test, guaranteed
Want to Be the Top School in Your Area?
- Simple & automated admin
- More time for teaching
- #1 learning materials for students
Start learning now
Resources
- Driver’s License Renewal
- How to Get Your US Driver’s License
- How to Prepare for Your Road Test
- How to Get a Driver’s Permit
- Behind-The-Wheel training
- Courses
- Blog
- FAQ
Show More
©2026 Zutobi AB, 4 Peddlers Row, Unit #103, Newark, DE 19702