loved by
15.1+ million
users
The 2026 Motoring Depreciation Report

When purchasing a new car, one of the most important considerations is whether or not the vehicle will hold its value. A well-retained resale value ensures that upgrading or replacing the car is financially smoother, making it a key factor for both first-time and seasoned buyers.
On average, cars in the USA experience a 35.22% depreciation rate over three years, while vehicles in the UK face a slightly higher average depreciation rate of 38.85%. These figures highlight the importance of selecting a vehicle that not only meets your needs but also retains a significant portion of its value over time. Understanding these averages can help buyers make informed decisions in a competitive and ever-changing automotive market.
Our 2026 update builds upon previous reports, revealing the vehicles with the highest and lowest levels of depreciation in the UK and the USA. This updated ranking offers insights into vehicles that hold their value best over three years and highlights those with significant depreciation, making them potential bargains on the second-hand market.
Which new cars hold their value best in the USA?
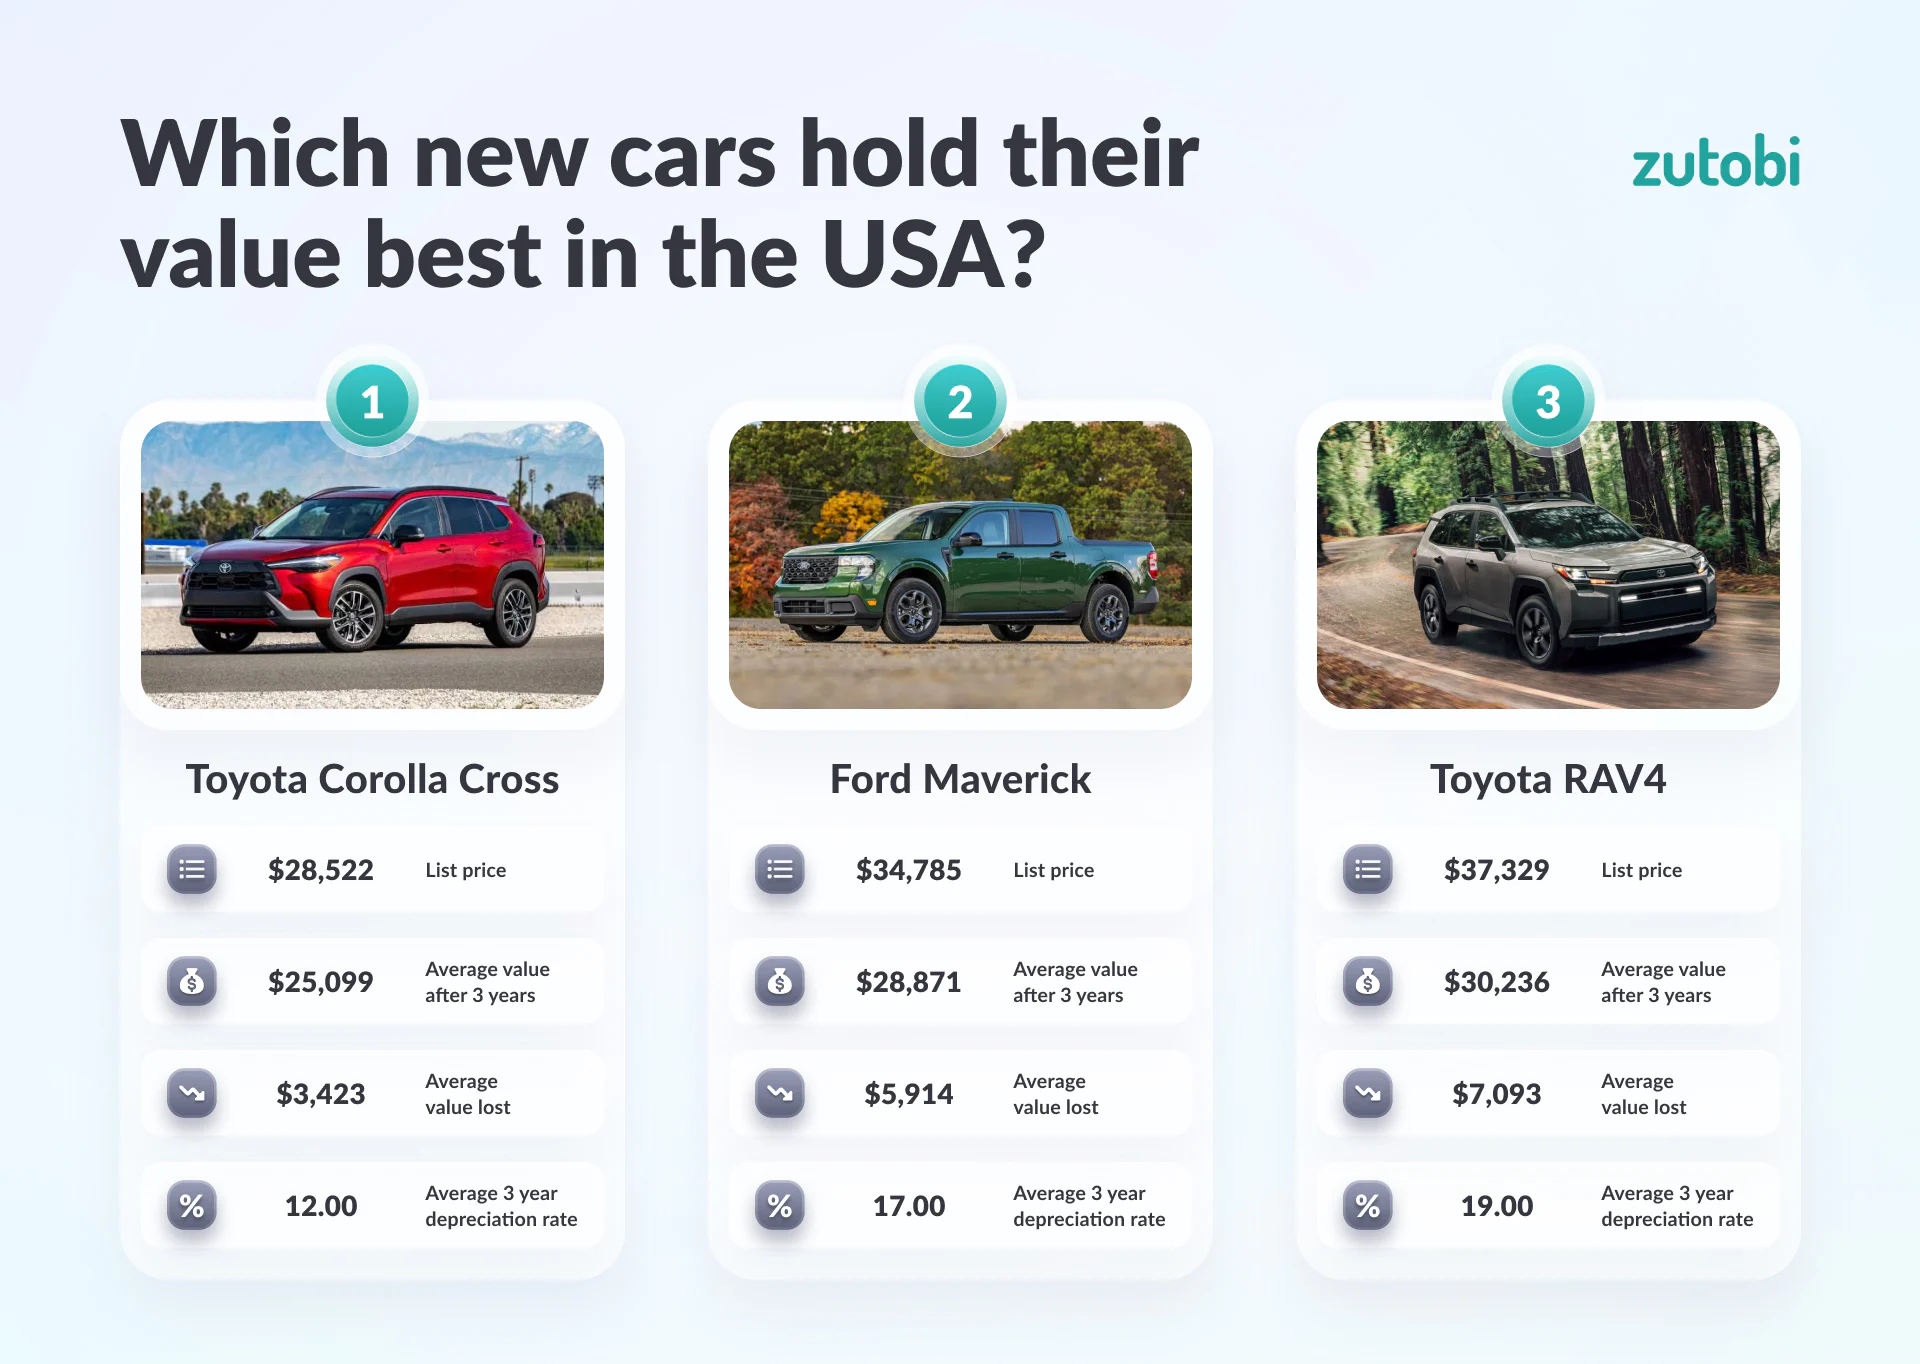
1 – Toyota Corolla Cross
List Price: $28,522
Average Value After 3 Years: $25,099
3-Year Depreciation Rate: 12.00%
The car which holds its value best in the United States is the Toyota Corolla Cross, a compact SUV built on the same reliable underpinnings as the standard Corolla. Its combination of practical size, strong fuel economy and Toyota’s reputation for dependability keeps demand high on the used market, resulting in one of the smallest drops in value of any car in this report.
2 – Ford Maverick
List Price: $34,785
Average Value After 3 Years: $28,871
3-Year Depreciation Rate: 17.00%
The Ford Maverick is a compact pickup that pairs genuine truck utility with a surprisingly affordable price tag and standard hybrid efficiency. That rare mix of practicality and value has kept waiting lists long and used examples in high demand, helping the Maverick hold onto its value far better than most trucks on sale today.
3 – Toyota RAV4
List Price: $37,329
Average Value After 3 Years: $30,236
3-Year Depreciation Rate: 19.00%
As one of the best-selling SUVs in America, the Toyota RAV4 benefits from sustained demand and a well-earned reputation for reliability. Its broad appeal across families, commuters and first-time SUV buyers means resale values stay strong, cementing its place among the vehicles that hold their worth best.
Which new cars hold their value best in the USA?
| Rank | Car | List Price | Average Value After 3 Years | Average Value Lost | Average 3 Year Depreciation Rate |
|---|---|---|---|---|---|
| 1 | Toyota Corolla Cross | $28,522 | $25,099 | $3,423 | 12.00% |
| 2 | Ford Maverick | $34,785 | $28,871 | $5,914 | 17.00% |
| 3 | Toyota RAV4 | $37,329 | $30,236 | $7,093 | 19.00% |
| 4 | Honda Civic | $28,545 | $23,121 | $5,424 | 19.00% |
| 5 | Toyota Tacoma | $45,080 | $36,514 | $8,566 | 19.00% |
| 6 | Toyota Sienna | $50,015 | $39,509 | $10,506 | 21.01% |
| 7 | Lexus RX | $61,542 | $48,002 | $13,540 | 22.00% |
| 8 | Toyota Tundra | $62,030 | $47,763 | $14,267 | 23.00% |
| 9 | Honda CR-V | $36,585 | $28,170 | $8,415 | 23.00% |
| 10 | Toyota 4Runner | $53,792 | $41,419 | $12,373 | 23.00% |
| 11 | Honda HR-V | $29,175 | $22,464 | $6,711 | 23.00% |
| 12 | Subaru Forester | $33,554 | $25,501 | $8,053 | 24.00% |
| 13 | Subaru CrossTrek | $31,495 | $23,936 | $7,559 | 24.00% |
| 14 | Toyota Grand Highlander | $48,852 | $37,127 | $11,725 | 24.00% |
| 15 | Volkswagen Jetta | $26,995 | $20,246 | $6,749 | 25.00% |
| 16 | Toyota Corolla | $25,763 | $19,322 | $6,441 | 25.00% |
| 17 | Hyundai Elantra | $24,750 | $18,315 | $6,435 | 26.00% |
| 18 | Jeep Wrangler | $58,015 | $42,931 | $15,084 | 26.00% |
| 19 | Ford Ranger | $45,210 | $33,455 | $11,755 | 26.00% |
| 20 | Chevrolet Trailblazer | $24,551 | $18,167 | $6,384 | 26.00% |
| 21 | Nissan Frontier | $36,259 | $26,106 | $10,153 | 28.00% |
| 22 | Nissan Kicks | $23,997 | $17,277 | $6,720 | 28.00% |
| 23 | Honda Accord | $32,086 | $22,781 | $9,305 | 29.00% |
| 24 | Ford Bronco | $60,245 | $42,773 | $17,472 | 29.00% |
| 25 | Honda Passport | $45,870 | $32,109 | $13,761 | 30.00% |
Which new cars lose the most value in the USA?
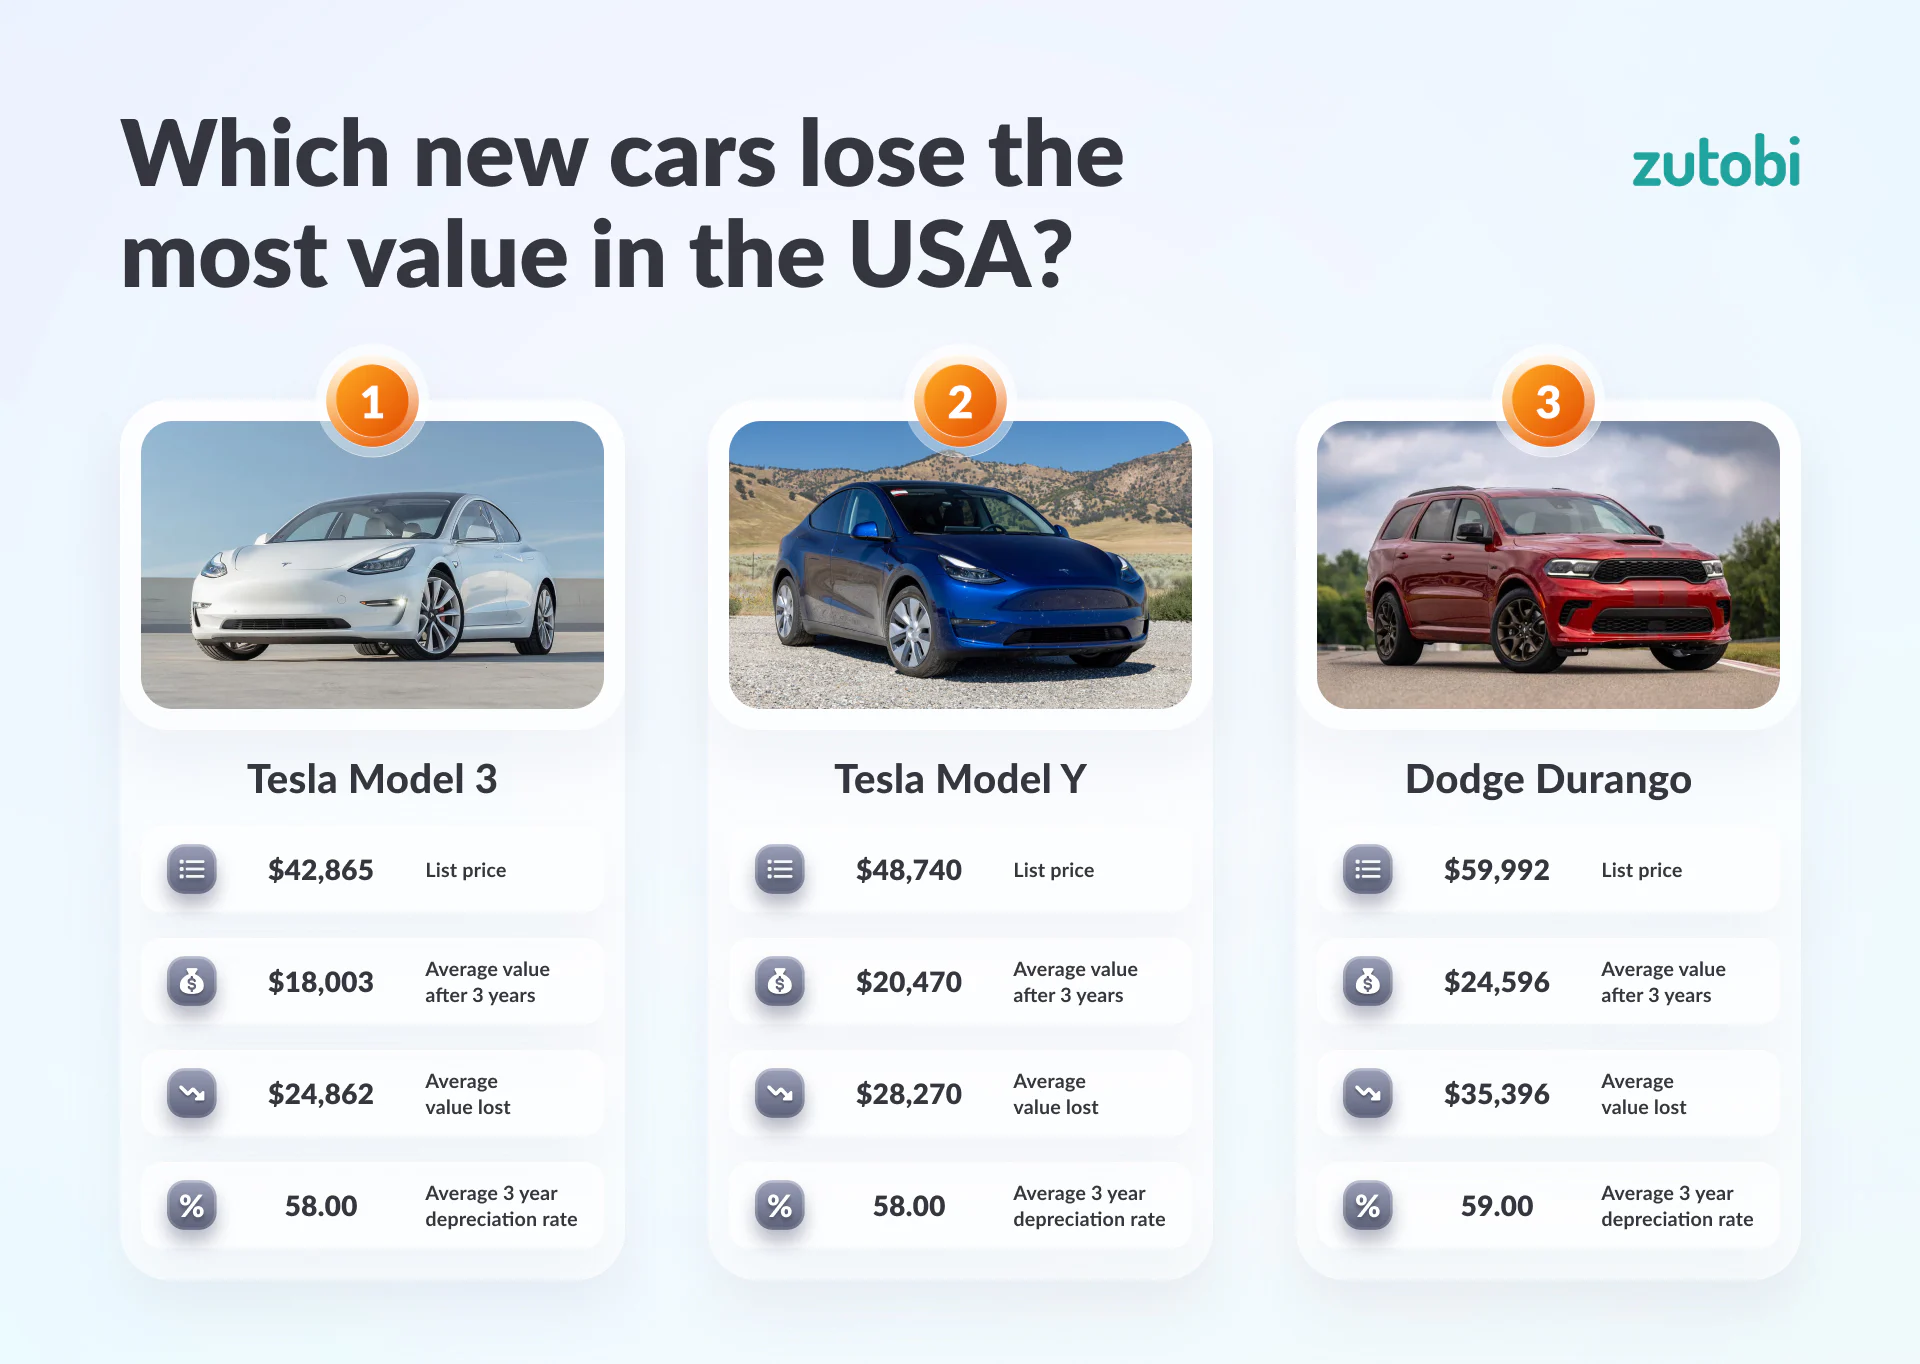
1 – Dodge Durango
List Price: $59,992
Average Value After 3 Years: $24,596
3-Year Depreciation Rate: 59.00%
The Dodge Durango is a three-row SUV known for offering rare V8 muscle in a family-friendly package. However, its ageing platform and a market that has increasingly moved toward hybrid and more efficient three-row crossovers work against it at resale. Buyers drawn to its power and towing capability should expect a steep drop in value within the first three years, making the Durango a strong option for used-car shoppers.
2 – Tesla Model Y
List Price: $48,740
Average Value After 3 Years: $20,470
3-Year Depreciation Rate: 58.00%
The Tesla Model Y is a popular electric SUV praised for its range, tech-forward cabin and quick acceleration. Frequent new-car price adjustments and growing competition from other EV makers have put sustained downward pressure on used values. As a result, the Model Y depreciates sharply within three years, despite its strong sales figures when new.
3 – Tesla Model 3
List Price: $42,865
Average Value After 3 Years: $18,003
3-Year Depreciation Rate: 58.00%
The Tesla Model 3 remains one of the most recognisable electric sedans on the road, offering strong performance and a minimalist interior. As with its SUV sibling, repeated pricing changes on new models and an increasingly crowded EV market have eroded resale values industry-wide. Three years in, Model 3 owners see one of the largest drops in value of any car in this report.
Which new cars lose the most value in the USA?
| Rank | Car | List Price | Average Value After 3 Years | Average Value Lost | Average 3 Year Depreciation Rate |
|---|---|---|---|---|---|
| 1 | Honda Pilot | $47,145 | $30,172 | $16,973 | 36.00% |
| 2 | Subaru Outback | $41,495 | $26,971 | $14,524 | 35.00% |
| 3 | Ram ProMaster | $50,978 | $33,135 | $17,843 | 35.00% |
| 4 | Chevrolet Colorado | $41,550 | $27,007 | $14,543 | 35.00% |
| 5 | GMC Yukon | $80,987 | $52,641 | $28,346 | 35.00% |
| 6 | Chevrolet Equinox | $29,930 | $19,753 | $10,177 | 34.00% |
| 7 | Subary Ascent | $46,395 | $30,620 | $15,775 | 34.00% |
| 8 | Kia Telluride | $42,860 | $28,287 | $14,573 | 34.00% |
| 9 | Chevrolet Tahoe | $72,200 | $47,652 | $24,548 | 34.00% |
| 10 | Buick Encore GX | $29,750 | $19,635 | $10,115 | 34.00% |
| 11 | Kia K5 | $31,240 | $20,930 | $10,310 | 33.00% |
| 12 | Mazda CX-30 | $30,153 | $20,202 | $9,951 | 33.00% |
| 13 | Nissan Sentra | $25,295 | $17,200 | $8,095 | 32.00% |
| 14 | Toyota Prius | $32,757 | $22,274 | $10,483 | 32.00% |
| 15 | Mazda 3 | $30,795 | $20,940 | $9,855 | 32.00% |
| 16 | Ford Bronco Sport | $36,055 | $24,517 | $11,538 | 32.00% |
| 17 | Kia Seltos | $27,640 | $18,795 | $8,845 | 32.00% |
| 18 | Toyota Highlander | $48,174 | $32,758 | $15,416 | 32.00% |
| 19 | Honda Odyssey | $43,243 | $29,405 | $13,838 | 32.00% |
| 20 | Kia K4 | $25,340 | $17,484 | $7,856 | 31.00% |
| 21 | GMC Canyon | $46,405 | $32,019 | $14,386 | 31.00% |
| 22 | Chevrolet Suburban | $68,660 | $47,375 | $21,285 | 31.00% |
| 23 | Honda Ridgeline | $42,393 | $29,251 | $13,142 | 31.00% |
| 24 | Mazda CX-50 | $36,400 | $25,116 | $11,284 | 31.00% |
| 25 | Toyota Camry | $30,784 | $21,548 | $9,236 | 30.00% |
Which new cars hold their value best in the UK?
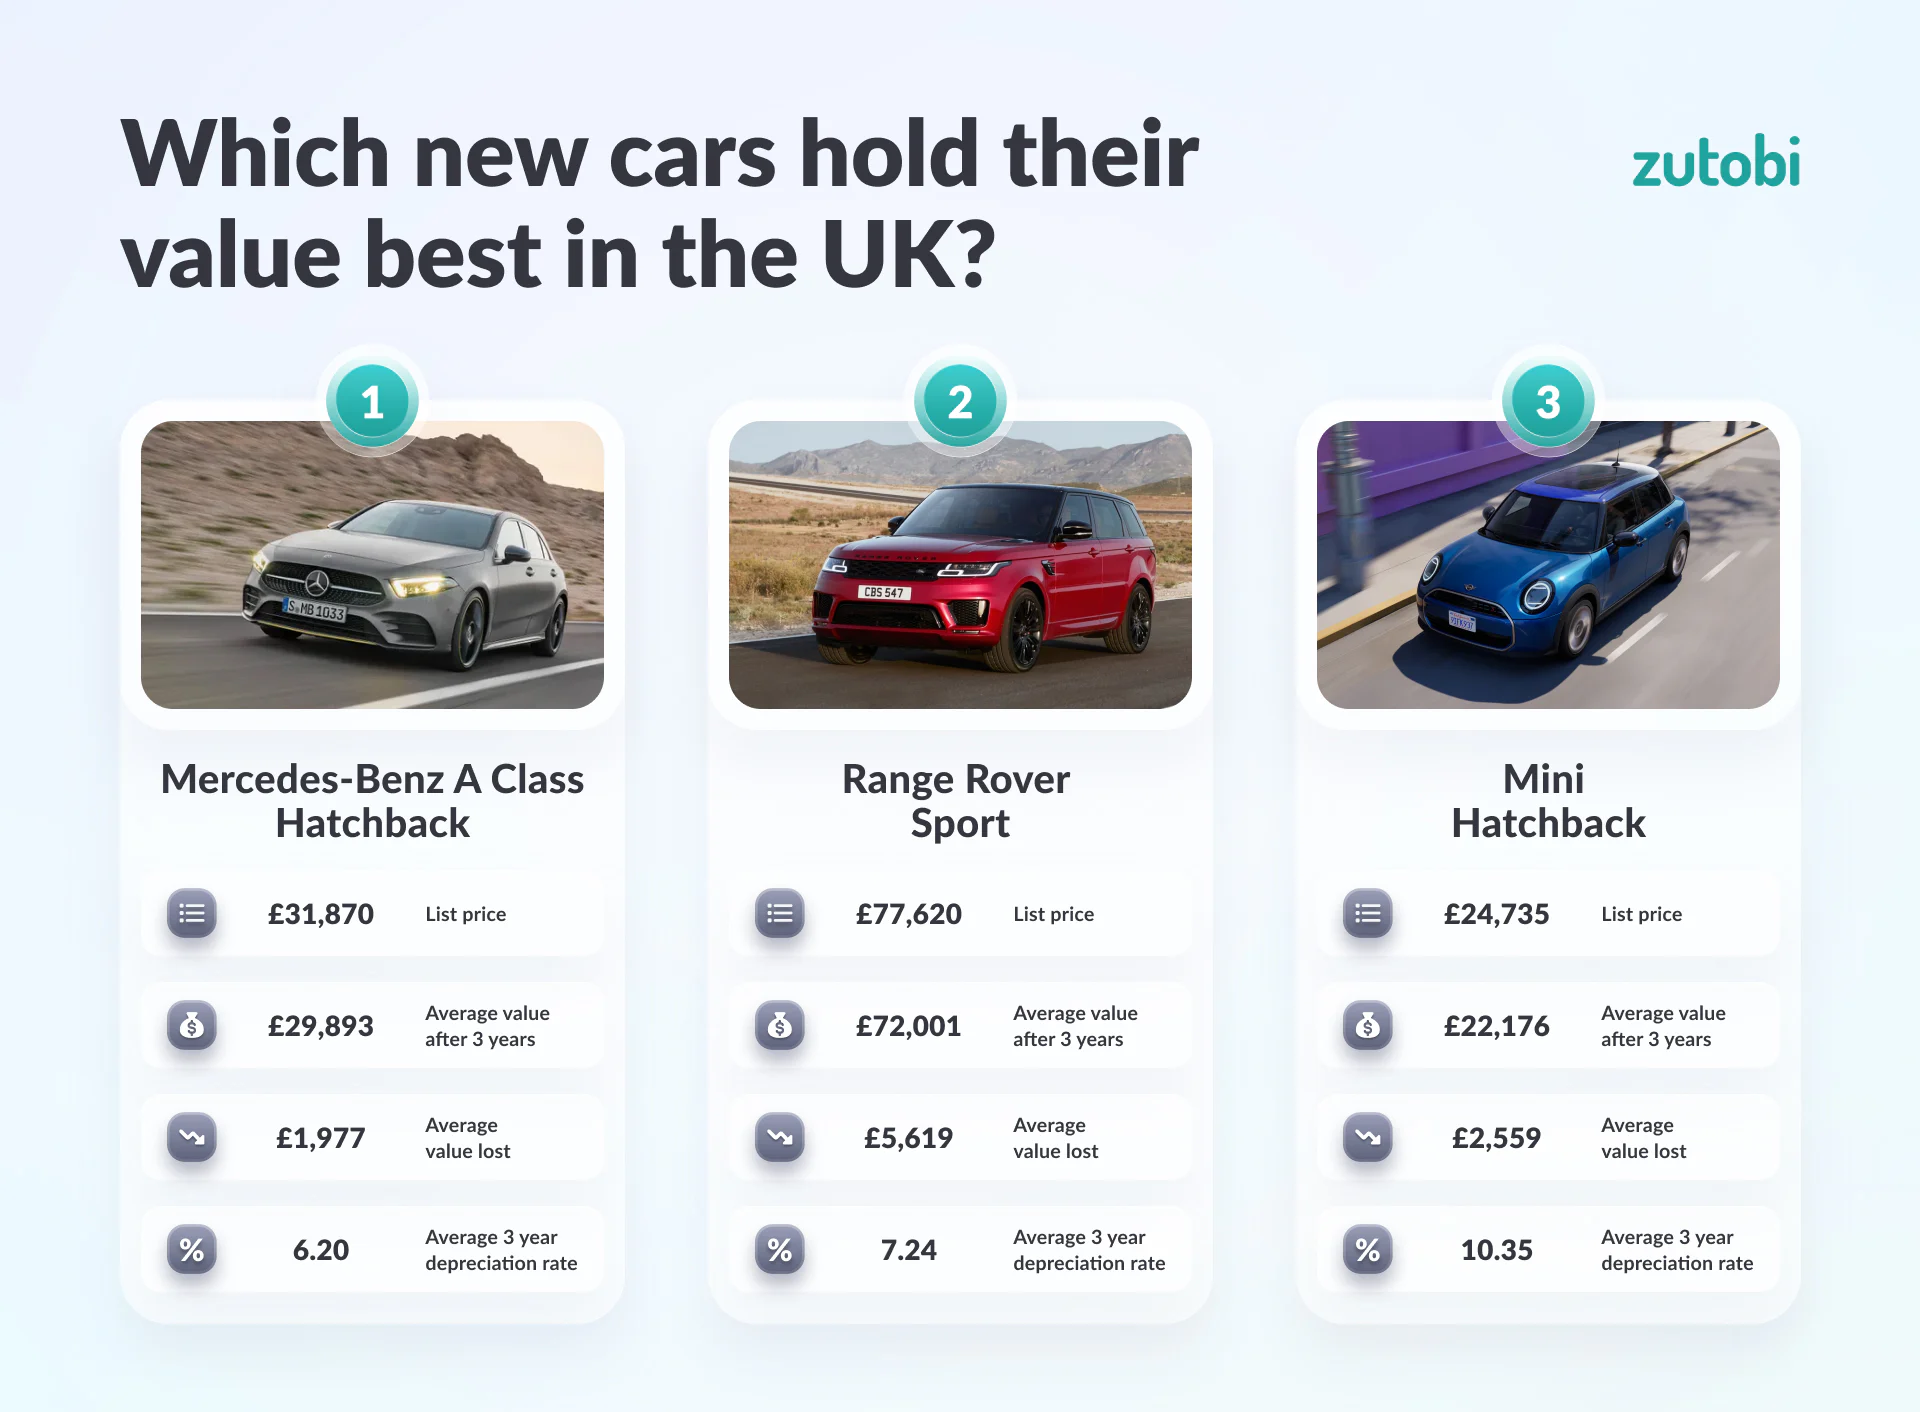
1 – Mercedes-Benz A-Class Hatchback
List Price: £31,870
Average Value After 3 Years: £29,893
3-Year Depreciation Rate: 6.20%
The entry-level Mercedes car is the small A-Class hatchback, a car that has improved vastly in style and substance since its launch in the late 90s. However, the Merc is still very expensive for the size of the car, and it is likely to be much more expensive than the base price with add-ons. Fortunately, the investment is a good one, as the A-Class only loses a tiny 6.20% of its value over three years.
2 – Range Rover Sport
List Price: £77,620
Average Value After 3 Years: £72,001
3-Year Depreciation Rate: 7.24%
Another vehicle with an average three-year depreciation rate of 7.24% is the Range Rover Sport. The Sport is slightly smaller than a standard Range Rover, with more of an emphasis on speed and performance than comfort and luxury, although it is still certainly considered a premium vehicle.
3 – Mini Hatchback
List Price: £24,735
Average Value After 3 Years: £22,176
3-Year Depreciation Rate: 10.35%
The Mini Hatchback pairs retro British styling with genuinely engaging handling, making it one of the most recognisable small cars on UK roads. Strong brand loyalty and consistently high demand in the used market help it hold its value well, with owners losing only 10.35% over three years.
Which new cars hold their value best in the UK?
| Rank | Model | List Price | Average Value After 3 Years | Average Value Lost | Average 3 Year Depreciation Rate |
|---|---|---|---|---|---|
| 1 | Mercedes-Benz A Class Hatchback | £31,870 | £29,893 | £1,977 | 6.20% |
| 2 | Range Rover Sport | £77,620 | £72,001 | £5,619 | 7.24% |
| 3 | Mini Hatchback | £24,735 | £22,176 | £2,559 | 10.35% |
| 4 | Volkswagen Polo | £21,055 | £18,659 | £2,396 | 11.38% |
| 5 | Toyota Corolla | £30,845 | £27,097 | £3,748 | 12.15% |
| 5 | Volkswagen Golf | £27,910 | £24,445 | £3,465 | 12.41% |
| 6 | Range Rover | £107,530 | £94,179 | £13,351 | 12.42% |
| 7 | Mercedes-Benz C Class Estate | £48,745 | £42,188 | £6,557 | 13.45% |
| 8 | Mercedes-Benz C 300 | £54,265 | £46,965 | £7,300 | 13.45% |
| 9 | Land Rover Discovery | £69,540 | £55,860 | £13,680 | 19.67% |
| 10 | Citroen C3 | £19,870 | £15,961 | £3,909 | 19.67% |
| 11 | Toyota Prius | £37,895 | £29,654 | £8,241 | 21.75% |
| 12 | Honda CR-V | £48,075 | £37,620 | £10,455 | 21.75% |
| 13 | Audi RS3 | £63,655 | £47,831 | £15,824 | 24.86% |
| 14 | Toyota Land Cruiser | £80,945 | £59,982 | £20,963 | 25.90% |
| 15 | Dacia Sandero | £14,765 | £10,941 | £3,824 | 25.90% |
| 16 | Dacia Duster | £23,595 | £17,240 | £6,355 | 26.93% |
| 18 | Porsche Cayenne | £78,300 | £57,209 | £21,091 | 26.94% |
| 19 | Hyundai IONIQ 5 | £40,695 | £29,733 | £10,962 | 26.94% |
| 20 | Mini Convertible | £28,975 | £20,870 | £8,105 | 27.97% |
| 21 | Fiat 600 | £23,995 | £17,283 | £6,712 | 27.97% |
| 22 | Volvo XC90 | £66,270 | £47,732 | £18,538 | 27.97% |
| 23 | Peugeot E-208 | £23,495 | £16,679 | £6,816 | 29.01% |
| 24 | Peugeot 208 | £18,995 | £13,484 | £5,511 | 29.01% |
| 25 | Mercedes-Benz B Class | £36,235 | £25,722 | £10,513 | 29.01% |
Which new cars lose the most value in the UK?
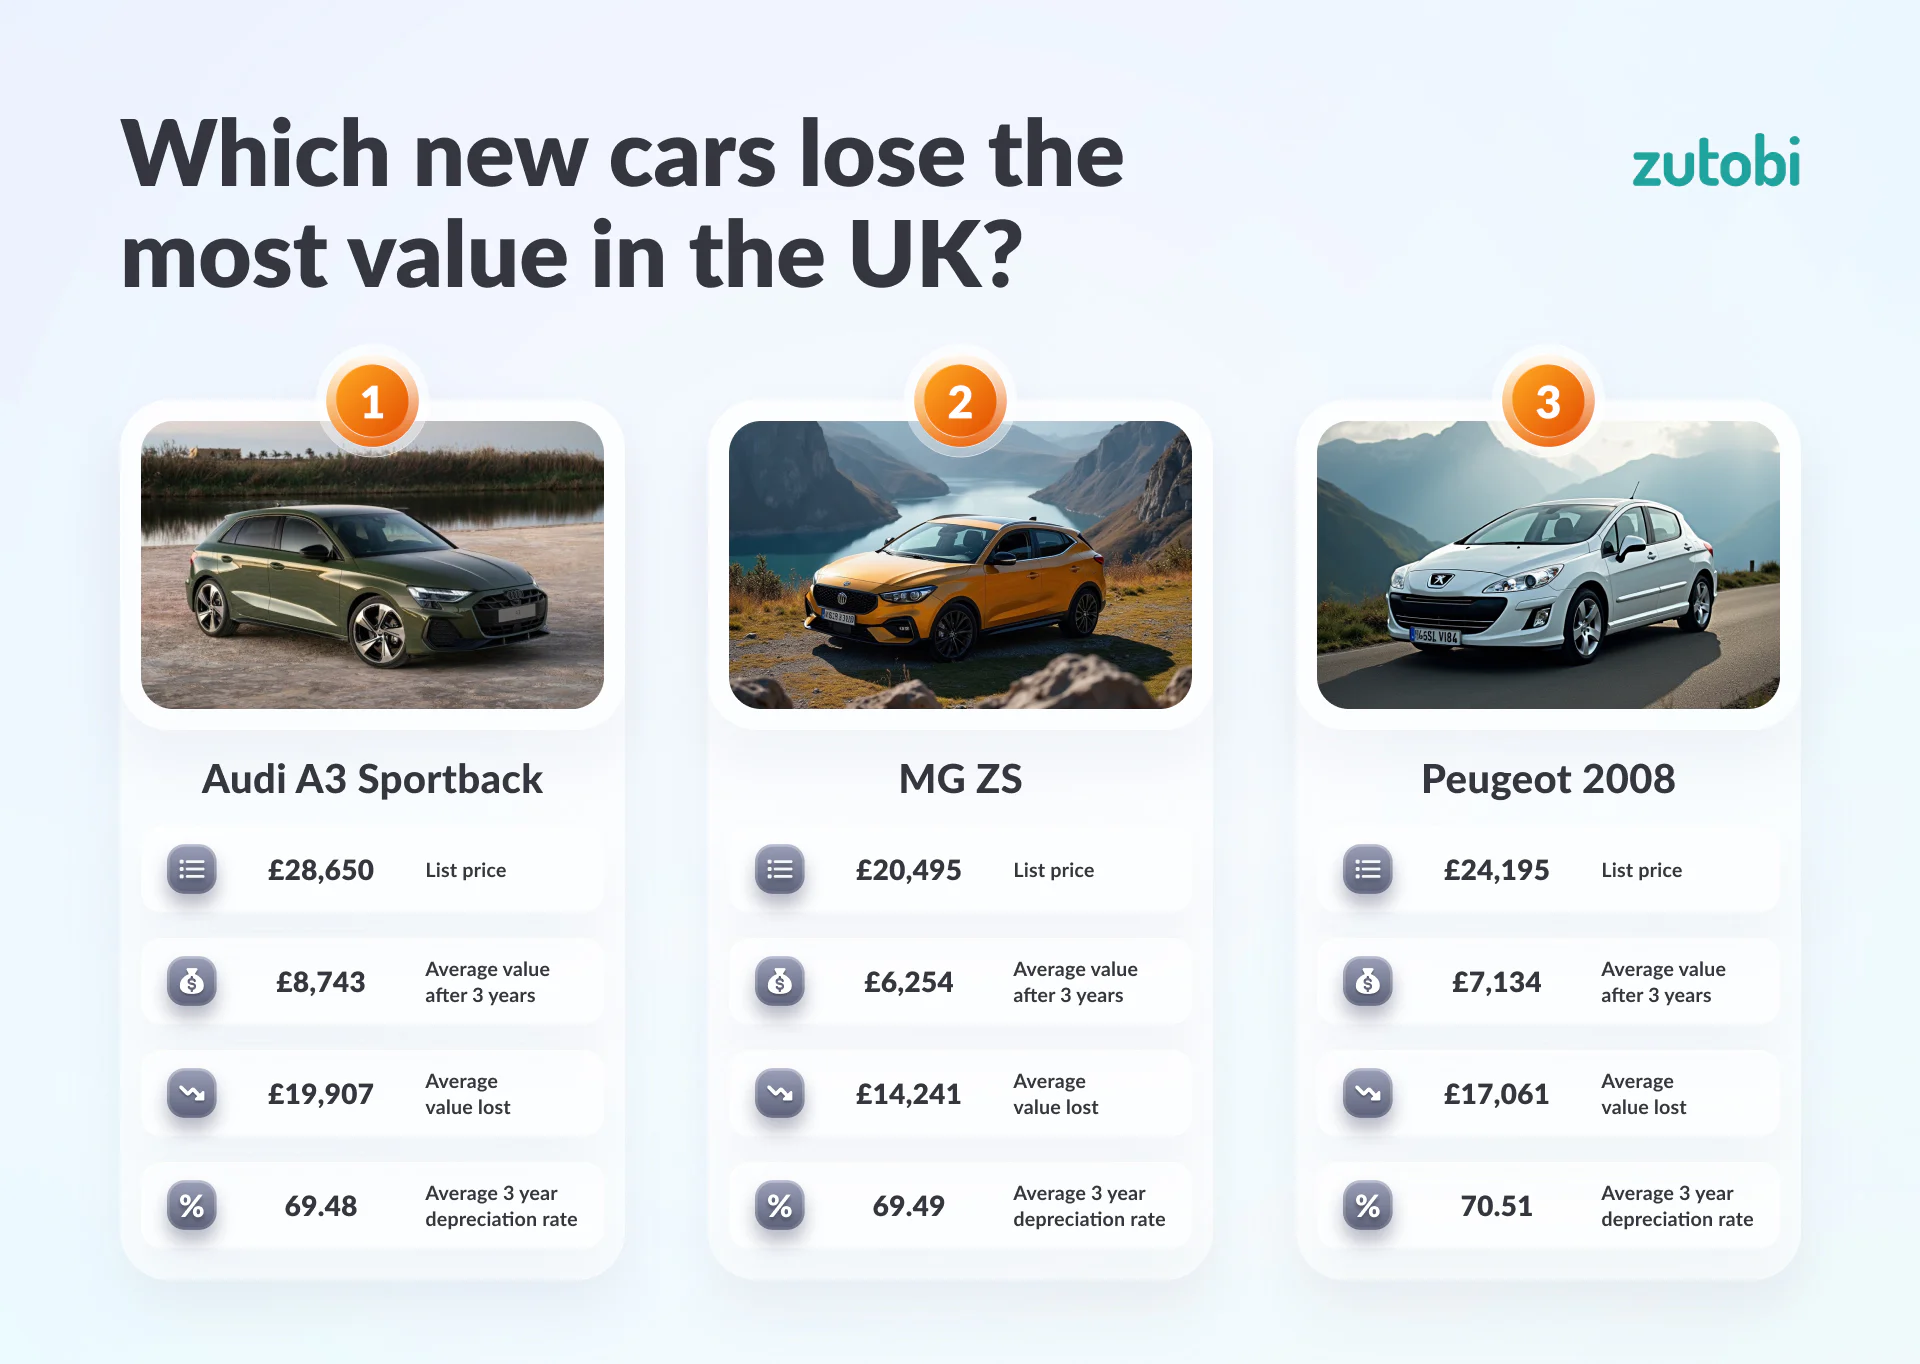
1 – Peugeot 2008
List Price: £24,195
Average Value After 3 Years: £7,134
3-Year Depreciation Rate: 70.51%
The Peugeot 2008 is a compact crossover that combines distinctive styling with everyday practicality, but it posts the sharpest depreciation of any car in this year’s ranking. Heavy competition in the small SUV segment and generous new-car discounting both work against resale values, leaving owners with barely a third of the car’s original value after three years.
2 – MG ZS
List Price: £20,495
Average Value After 3 Years: £6,254
3-Year Depreciation Rate: 69.49%
Although the badge says MG, this car is made on the other side of the world from the company’s home in Oxford. These days the MG name and brand are owned by Chinese car company SAIC, however, this is not necessarily a bad thing given the reliability (and later financial) problems faced by MG in Britain. Although the ZS is reasonably priced, it will lose over 69% of its value in three years, dropping from just over £20,000 in value to just over £6,000.
3 – Audi A3 Sportback
List Price: £28,650
Average Value After 3 Years: £8,743
3-Year Depreciation Rate: 69.48%
The Audi A3 Sportback trades on its premium badge and upmarket cabin when new, but that same premium pricing leaves it with further to fall on the used market. After three years, owners are left with less than a third of the car’s original value, placing the A3 Sportback among the biggest depreciators in this year’s UK ranking.
Which new cars lose the most value in the UK?
| Rank | Model | List Price | Average Value After 3 Years | Average Value Lost | Average 3 Year Depreciation Rate |
|---|---|---|---|---|---|
| 1 | Peugeot 2008 | £24,195 | £7,134 | £17,061 | 70.51% |
| 2 | MG ZS | £20,495 | £6,254 | £14,241 | 69.49% |
| 3 | Audi A3 Sportback | £28,650 | £8,743 | £19,907 | 69.48% |
| 4 | Audi A8 | £85,840 | £32,414 | £53,426 | 62.24% |
| 5 | Peugeot 5008 | £37,045 | £14,756 | £22,289 | 60.17% |
| 6 | Peugeot 3008 | £33,445 | £13,669 | £19,776 | 59.13% |
| 7 | Mercedes-Benz E CLass Saloon | £57,170 | £24,552 | £32,618 | 57.05% |
| 8 | Kia Sportage | £27,795 | £12,225 | £15,570 | 56.02% |
| 9 | Audi A6 Saloon | £52,110 | £23,460 | £28,650 | 54.98% |
| 10 | Volvo XC60 | £59,320 | £26,706 | £32,614 | 54.98% |
| 11 | Vauxhall Astra | £29,995 | £13,815 | £16,180 | 53.94% |
| 12 | Volkswagen Touareg | £71,655 | £33,003 | £38,652 | 53.94% |
| 13 | Kia Sorento | £45,635 | £21,019 | £24,616 | 53.94% |
| 14 | BMW X5 | £75,860 | £36,515 | £39,345 | 51.87% |
| 15 | Vauxhall Mokka | £25,920 | £12,477 | £13,443 | 51.86% |
| 16 | Mini Cooper | £25,740 | £12,657 | £13,083 | 50.83% |
| 17 | Audi Q5 | £52,360 | £25,747 | £26,613 | 50.83% |
| 18 | Mini One | £24,735 | £12,163 | £12,572 | 50.83% |
| 19 | Peugeot 308 | £28,495 | £14,012 | £14,483 | 50.83% |
| 20 | Ford Kuga | £33,335 | £16,738 | £16,597 | 49.79% |
| 21 | Mercedes-Benz GLC | £54,970 | £27,602 | £27,368 | 49.79% |
| 22 | BMW 5 Series Touring | £53,110 | £27,219 | £25,891 | 48.75% |
| 23 | Audi A5 | £42,760 | £21,915 | £20,845 | 48.75% |
| 24 | Suzuki Swift | £19,999 | £10,250 | £9,749 | 48.75% |
| 25 | Volkswagen Golf eHybrid | £35,490 | £18,557 | £16,933 | 47.71% |
Methodology
USA
- A list of the 100 best-selling cars in the USA in 2026 was sourced from GoodCarBadCar.
- The value of these cars was found using Edmunds’s new car pricing tool.
- We then used CarEdge’s depreciation calculator to find each car’s 3-year depreciation rate and applied it to the Edmunds price.
UK
- A list of 150 of the UK’s most popular new cars was created (reduced to 121 as data couldn’t be found on all models).
- The individual manufacturer’s websites were used to discover the base value of each car.
- A UK car depreciation calculator was then used to determine the average estimated value in three years’ time.
Previous Reports

Take our full course with tests and theory
600+ exam-like questions and practice tests
Easy summarized DMV handbook
America’s #1 driver’s ed app with a 95.8% pass rate
Recommended articles




Ace your DMV test, guaranteed
Want to Be the Top School in Your Area?

- Simple & automated admin
- More time for teaching
- #1 learning materials for students
Start learning now
Resources
- Driver’s License Renewal
- How to Get Your US Driver’s License
- How to Prepare for Your Road Test
- How to Get a Driver’s Permit
- Behind-The-Wheel training
- Courses
- Blog
- FAQ
Show More


©2026 Zutobi AB, 4 Peddlers Row, Unit #103, Newark, DE 19702