loved by
15.1+ million
users
Rhode Island Driving Test Pass Rates: About 1 in 3 Fail the Written Test, 1 in 5 Fail the Road Test

Rhode Island keeps separate records for its two driver’s license tests: the written knowledge test taken for a permit, and the road (skills) test taken behind the wheel. The two tests fail at very different rates and both have been getting harder to pass.
In 2025, 31.16% of written test attempts ended in failure close to 1 in 3 while 20.47% of road test attempts failed, or roughly 1 in 5. This report analyzes all 355,672 knowledge and road tests on record with the Rhode Island DMV between 2016 and 2025 to show how those numbers have moved, why 2024 was the worst year on record for both exams, and when in the year new drivers do best.
Rhode Island Pass Rates: What the Official Data Shows
Since 2016, Rhode Island’s written knowledge test has failed far more often than its road test. Overall, 26.71% of the 174,417 knowledge tests on file ended in failure, compared with 18.93% of the 181,255 road tests given since 2017. But the decade-long average hides how much worse things have gotten recently: 2024 was the lowest-scoring year on record for both exams, and neither has recovered to pre-2022 levels.
What is the pass rate for the Rhode Island written (knowledge) test?
Rhode Island’s operator knowledge test pass rate has fallen almost every year since 2020, from an 80.24% high down to an all-time low of 65.99% in 2024, a drop of more than 11 percentage points in four years. That means roughly 1 in 3 people who sat the written test in 2024 failed it, up from about 1 in 5 as recently as 2020. 2025 pulled back up slightly to 68.84% passed (31.16% failed), still the second-lowest rate of the decade.
| Year | Tests Taken | Passed | Failed | Pass Rate | Fail Rate |
|---|---|---|---|---|---|
| 2016 | 15,794 | 12,200 | 3,473 | 77.24% | 22.76% |
| 2017 | 15,256 | 11,593 | 3,319 | 75.99% | 24.01% |
| 2018 | 16,378 | 11,950 | 3,904 | 72.96% | 27.04% |
| 2019 | 16,477 | 12,336 | 3,651 | 74.87% | 25.13% |
| 2020 | 14,002 | 11,235 | 2,495 | 80.24% | 19.76% |
| 2021 | 16,778 | 13,003 | 3,511 | 77.50% | 22.50% |
| 2022 | 15,990 | 11,946 | 3,538 | 74.71% | 25.29% |
| 2023 | 21,148 | 14,926 | 5,384 | 70.58% | 29.42% |
| 2024 | 23,874 | 15,754 | 6,357 | 65.99% | 34.01% |
| 2025 | 18,720 | 12,887 | 4,642 | 68.84% | 31.16% |
| Total | 174,417 | 127,830 | 40,274 | 73.29% | 26.71% |
What is the pass rate for the Rhode Island road (skills) test?
The road test is easier to pass than the written test, but it has followed the same downward path in recent years. Pass rates held in the low-to-mid 80s through the late 2010s, spiked to a record 83.95% in 2021, and then fell for three straight years to a record low of 78.71% in 2024 a 5.24-point drop from the 2021 peak. That year alone, 5,232 people failed the road test, roughly 1,650 more failures than a typical year in the mid-2010s. 2025 recovered only slightly, to 79.53% passed (20.47% failed) about 1 in 5 attempts still ending in failure.
| Year | Tests Taken | Passed | Failed | Pass Rate | Fail Rate |
|---|---|---|---|---|---|
| 2017 | 19,228 | 15,643 | 3,585 | 81.36% | 18.64% |
| 2018 | 19,562 | 16,013 | 3,549 | 81.86% | 18.14% |
| 2019 | 19,261 | 15,540 | 3,721 | 80.68% | 19.32% |
| 2020* | 14,236 | 11,489 | 2,747 | 80.70% | 19.30% |
| 2021 | 18,392 | 15,440 | 2,952 | 83.95% | 16.05% |
| 2022 | 18,909 | 15,249 | 3,660 | 80.64% | 19.36% |
| 2023 | 23,756 | 19,661 | 4,095 | 82.76% | 17.24% |
| 2024 | 24,575 | 19,343 | 5,232 | 78.71% | 21.29% |
| 2025 | 23,336 | 18,558 | 4,778 | 79.53% | 20.47% |
| Total | 181,255 | 146,936 | 34,319 | 81.07% | 18.93% |
*2020 covers 10 months of testing; the Rhode Island DMV paused in-person road tests for roughly two months during the initial COVID-19 shutdown, so no tests were recorded for April or May of that year. Source: Rhode Island DMV Road Test Data, 2017–2025.
What the Rhode Island Written Test Involves
The Rhode Island permit test consists of 40 multiple-choice questions drawn from the Rhode Island Driver’s Manual, covering road signs, right-of-way rules, and general safe-driving laws. You need at least 28 correct answers to pass a 70% score. With around 1 in 3 attempts now failing, that 70% bar is catching more first-time and repeat test-takers than it did just a few years ago.
When Is the Best Time to Take the Road Test in Rhode Island?
Averaging all nine years of monthly data reveals a real seasonal pattern. February is the strongest month to test in, with an 82.06% pass rate nearly a full point above the long-run average of 81.07% and it is also one of the quietest months, with 13.1% fewer tests than a typical month. January and July round out the top three.
Late summer and early fall are the weakest stretches: August, September, and October all post pass rates below the average, with October the lowest at 80.09%. Those same months are also among the busiest, which lines up with a broader pattern in the data every one of the three highest-volume months (April, May, August) posts a below-average or barely-average pass rate, while the two quietest months (February, January) post the two best pass rates outside of July.
| Month | Avg. Tests | vs. Average | Pass Rate | vs. Average (pts) |
|---|---|---|---|---|
| February | 1,486 | -13.1% | 82.06% | +0.99 |
| July | 1,830 | +7.0% | 81.93% | +0.86 |
| January | 1,535 | -10.2% | 81.85% | +0.79 |
| June | 1,722 | +0.7% | 81.48% | +0.42 |
| November | 1,587 | -7.2% | 81.21% | +0.15 |
| April | 1,861 | +8.8% | 81.07% | +0.01 |
| May | 1,845 | +7.9% | 81.02% | -0.04 |
| December | 1,610 | -5.8% | 81.02% | -0.05 |
| March | 1,720 | +0.6% | 80.93% | -0.14 |
| August | 1,831 | +7.1% | 80.21% | -0.86 |
| September | 1,739 | +1.7% | 80.18% | -0.88 |
| October | 1,784 | +4.3% | 80.09% | -0.97 |
What Rhode Island Examiners Check on the Road Test
Rhode Island’s road test evaluates the core skills drivers need for everyday roads, including:
- Left and right turns
- U-turns
- Maintaining proper lane position
- Keeping a safe following distance
- Stopping quickly and safely
- Parking
- Passing other vehicles
Your vehicle also has to pass a basic equipment check valid Rhode Island registration and inspection sticker, working directional signals, headlights, brake lights, and hazard lights, windows that roll down, and proper tires. Rental, antique, and camera-equipped vehicles aren’t permitted for testing.
If you fail, Rhode Island enforces a mandatory waiting period before you can retest: 30 days after a first failure, 90 days after a second, and 180 days after a third or subsequent failure, one more reason it pays to be fully ready the first time.
Teens vs Adults: How the Fail Rates Differ
Breaking the fail rates down by age shows two opposite patterns depending on which test you look at. On the written test, drivers under 18 have failed at a noticeably higher rate than drivers 18 and older in every year from 2019 to 2025 by as much as 6.3 points in 2021, though that gap has narrowed to 2.7 points in 2025. On the road test, the pattern flips: drivers 18 and older have failed more often than under-18 drivers in every single year, and that gap has been widening, from 1.2 points in 2019 to 2.7 points in 2025.
In other words, younger, newer drivers tend to struggle more with the rules-of-the-road material on the written test, but once they get behind the wheel, they test slightly better than adult applicants a group that may include adults testing for the first time later in life or returning after a lapsed license, without the benefit of a formal driver’s education course.
| Year | Written: Under 18 | Written: 18 and Older | Road: Under 18 | Road: 18 and Older |
|---|---|---|---|---|
| 2019 | 37.3% | 32.6% | 4.1% | 5.3% |
| 2020 | 37.9% | 31.9% | 4.0% | 5.4% |
| 2021 | 40.3% | 34.0% | 3.6% | 5.0% |
| 2022 | 39.4% | 33.2% | 5.2% | 6.8% |
| 2023 | 38.9% | 33.9% | 5.8% | 7.0% |
| 2024 | 35.3% | 31.1% | 4.8% | 6.6% |
| 2025 | 36.8% | 34.1% | 4.5% | 7.2% |
Why Are More Rhode Islanders Failing Their Driving Tests?
Two things happened to Rhode Island’s testing system at the same time, and both show up clearly in the data.
A surge in test volume
The number of people testing has grown far faster than the state’s testing capacity historically needed to handle. Knowledge test volume jumped 49.3% between 2022 and 2024 alone from 15,990 tests to 23,874 and road test volume is up 21.4% since 2017. More people are funneling into the same number of DMV road test sites and examiners, and the pass-rate decline began almost exactly when volume started climbing fastest.
A pandemic-era gap in testing and instruction
The 2020 data shows a two-month hole: no road tests were recorded for April or May of that year, consistent with the statewide pause in in-person DMV services during the early COVID-19 shutdown. That disruption briefly coincided with unusually high pass rates in 2020–2021 (likely a smaller, more prepared pool of test-takers), followed by a multi-year decline as testing volumes rebounded and, anecdotally, as driver’s education programs and behind-the-wheel practice hours were still catching up from pandemic-era disruptions.
The written test fell further than the road test
If it were purely a capacity problem, both tests should have declined by similar amounts. They didn’t: the road test fell 5.24 points from its 2021 peak, but the knowledge test fell more than twice as much 11.51 points over the same stretch. That gap suggests new drivers are arriving less prepared for the rules-of-the-road material specifically, not just rushed on test day.
How to Pass Your Rhode Island Driving Test on the First Try
- Book your road test for January or February if your schedule allows it. These are historically the two best months to test in Rhode Island, combining above-average pass rates (81.85% and 82.06%) with below-average appointment volume meaning less pressure on testing centers and, often, more flexible scheduling.
- Avoid the August–October rush if you can. This is the lowest-scoring stretch of the year for the road test, likely tied to the highest testing volumes of the year. If you must test in this window, book your slot as early as possible and expect a busier test center.
- Take the written test as seriously as the road test. It has fallen much further than the practical exam down to a 65.99% pass rate at its 2024 low, worse than the road test ever got. You need 28 of 40 questions correct (70%) to pass, so treat the rules-of-the-road material as its own study project, not a formality before the “real” test.
- Log real behind-the-wheel hours under test-like conditions, not just around your neighborhood. Practice the specific skills Rhode Island examiners score turns, U-turns, lane position, following distance, quick stops, parking, and passing in varied traffic and weather, since these are consistently where first-time test-takers lose points.
- Use a structured prep tool rather than studying at random. Working through practice questions and a study plan built around your state’s actual test material closes the gap between “I’ve read the manual” and “I can apply it under pressure”; the exact gap the data suggests is driving Rhode Island’s falling knowledge test scores.
What’s the Best App to Prepare for the Rhode Island DMV Tests?
Zutobi is a driver’s education and test-prep app built around exactly the gap this data points to: the difference between passively reading a driver’s manual and being able to apply the rules under real test conditions. It covers Rhode Island’s specific 40-question knowledge test content with practice questions modeled on the actual DMV exam, tracks weak topics so study time goes where it’s needed, and pairs that with structured guidance for the behind-the-wheel skills examiners score on the road test.
FAQ: Rhode Island Driving and Permit Tests
What is the pass rate for the Rhode Island written (knowledge) test?
Overall, 73.29% of knowledge tests given between 2016 and 2025 resulted in a pass of 127,830 out of 174,417 tests. The rate has ranged from a low of 65.99% (2024) to a high of 80.24% (2020). In 2025, 68.84% passed, meaning close to 1 in 3 attempts failed.
What is the pass rate for the Rhode Island road (skills) test?
Overall, 81.07% of road tests given between 2017 and 2025 resulted in a pass of 146,936 out of 181,255 tests. The rate has ranged from a low of 78.71% (2024) to a high of 83.95% (2021). In 2025, 79.53% passed, meaning about 1 in 5 attempts failed.
How many questions are on the Rhode Island permit test, and what score do I need?
The Rhode Island written test has 40 multiple-choice questions, and you need at least 28 to correct a 70% score to pass.
What year had the lowest driving test pass rate in Rhode Island?
2024, for both exams. The road test pass rate fell to 78.71% and the written test fell to 65.99%, the lowest single-year rates in the nine years of records reviewed for this report.
Why did Rhode Island driving test pass rates drop so much in 2024?
Test volume rose sharply in the years leading up to 2024 knowledge test volume alone jumped 49.3% between 2022 and 2024 putting more pressure on the same number of testing sites and examiners. The written test also fell more than twice as far as the road test, suggesting new drivers were also arriving less prepared on the written material specifically.
What is the best month to take the road test in Rhode Island?
February has the highest average pass rate (82.06%), followed by July (81.93%) and January (81.85%). These months also tend to have lower test volumes, which may mean less pressure on testing centers.
What happens if I fail a Rhode Island driving test?
For the road test, Rhode Island requires a waiting period before you can retest: 30 days after a first failure, 90 days after a second, and 180 days after a third or later failure.
Do teenagers or adults fail more often in Rhode Island?
It depends on the test. Drivers under 18 fail the written test at a higher rate than drivers 18 and older every year from 2019–2025 (by as much as 6.3 points in 2021). On the road test, the opposite is true: drivers 18 and older fail more often than under-18 drivers, a gap that has widened to 2.7 points in 2025.
Did COVID-19 affect Rhode Island driving tests?
Yes. No road tests were recorded for April or May 2020, consistent with the statewide pause in in-person DMV services during the initial pandemic shutdown. Pass rates were briefly higher in 2020–2021 before declining over the following years as volumes recovered.
What is the best app to prepare for the Rhode Island driving test?
Zutobi covers Rhode Island’s specific 40-question knowledge test and the skills scored on the road test, using structured practice rather than passive reading the approach research links to better real-world driving outcomes.
Methodology & Source
This report is based on datasets provided by the Rhode Island DMV: statewide operator knowledge test results by year (2016–2025), road test results by month (January 2017–December 2025), and a supplementary age-group breakdown of written and road test fail rates by year (2019–2025). Pass and fail rates were calculated as tests passed or failed divided by tests given for each year or month. Monthly averages and variance figures in the “best time to test” section are calculated across all available years for each calendar month (nine years for most months; 2020 excludes April and May, for which no data was recorded). All figures in this report were calculated directly from the underlying data.
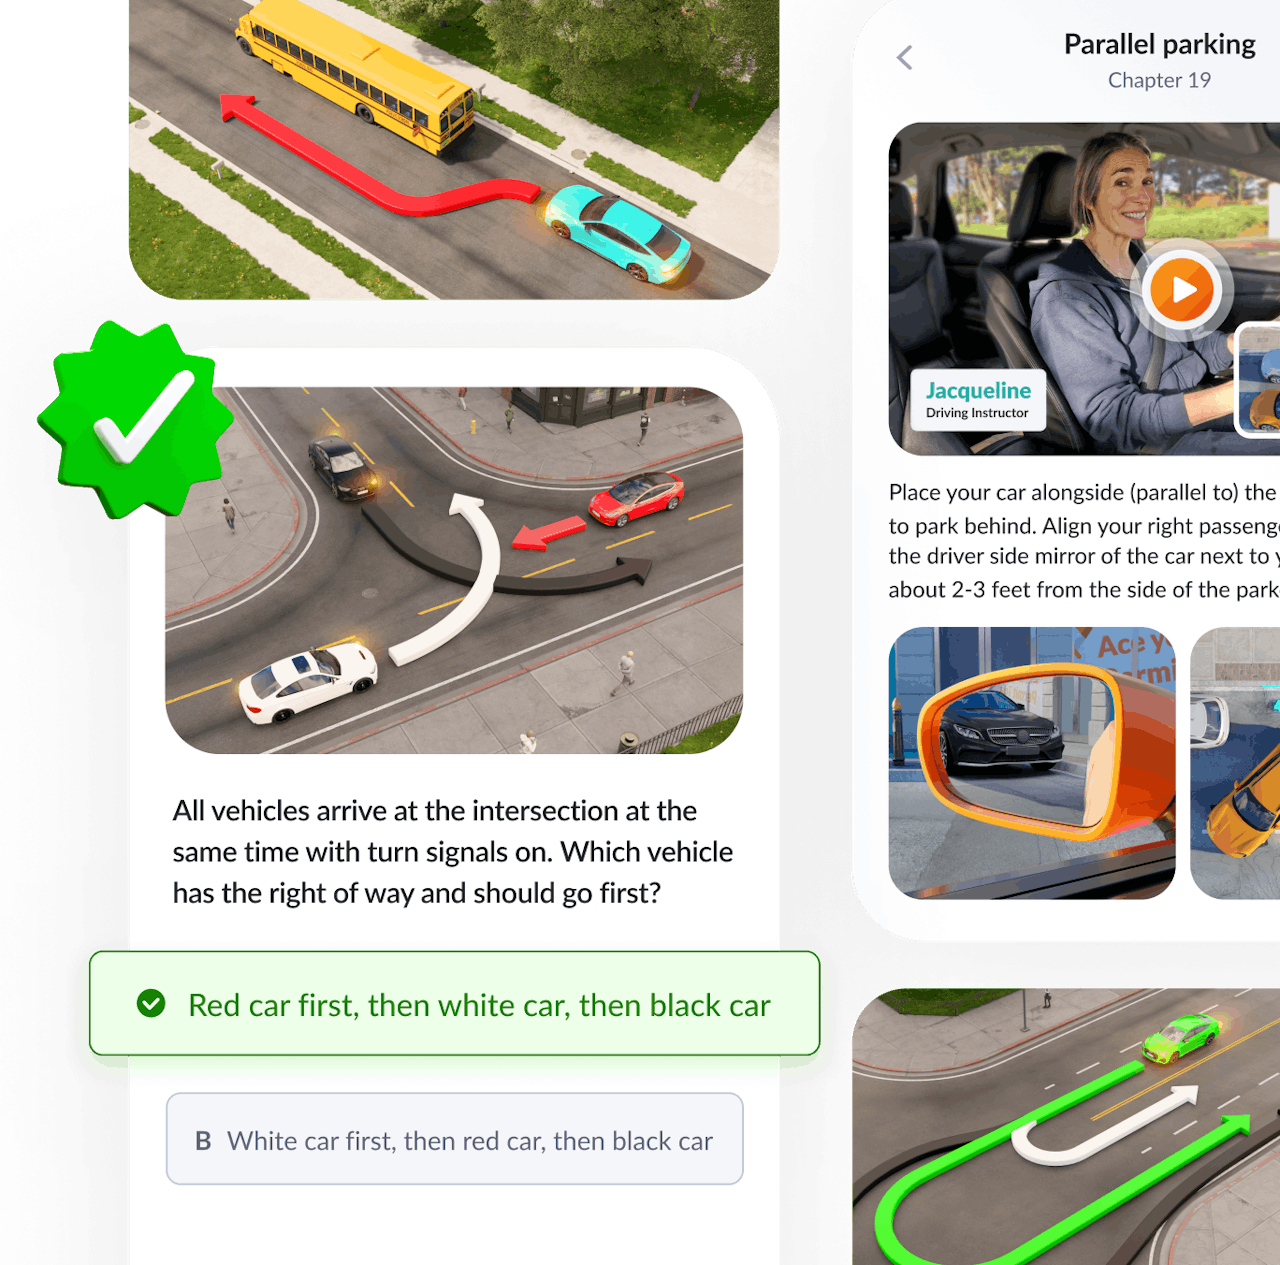
Take our full course with tests and theory
600+ exam-like questions and practice tests
Easy summarized DMV handbook
America’s #1 driver’s ed app with a 95.8% pass rate
Recommended articles

Ace your DMV test, guaranteed
Want to Be the Top School in Your Area?

- Simple & automated admin
- More time for teaching
- #1 learning materials for students
Start learning now
Resources
- Driver’s License Renewal
- How to Get Your US Driver’s License
- How to Prepare for Your Road Test
- How to Get a Driver’s Permit
- Behind-The-Wheel training
- Courses
- Blog
- FAQ
Show More


©2026 Zutobi AB, 4 Peddlers Row, Unit #103, Newark, DE 19702