loved by
15.1+ million
users

Teen Driver Report – The States with the Most and Least Teenage Driving Fatalities
Each year, thousands of teens lose their lives in car crashes, and hundreds of thousands are treated in emergency departments for injuries related to motor vehicle crashes. For years, traffic crashes have been the #1 teenage killer in America.
The Zutobi team took a deep dive into the topic. First, we examined what factors contributed to teen deaths on the road, including drinking while under the influence (DUI), speeding, distracted driving, and other causes. Then, we ranked each state from best to worst and reported the number of deaths per 100,000 teen drivers per state. Our team also looked at the historical statistics and considered what programs and initiatives may have contributed to the decrease.
Note: Driving statistics takes time to collect. This report features the latest data released in 2026.
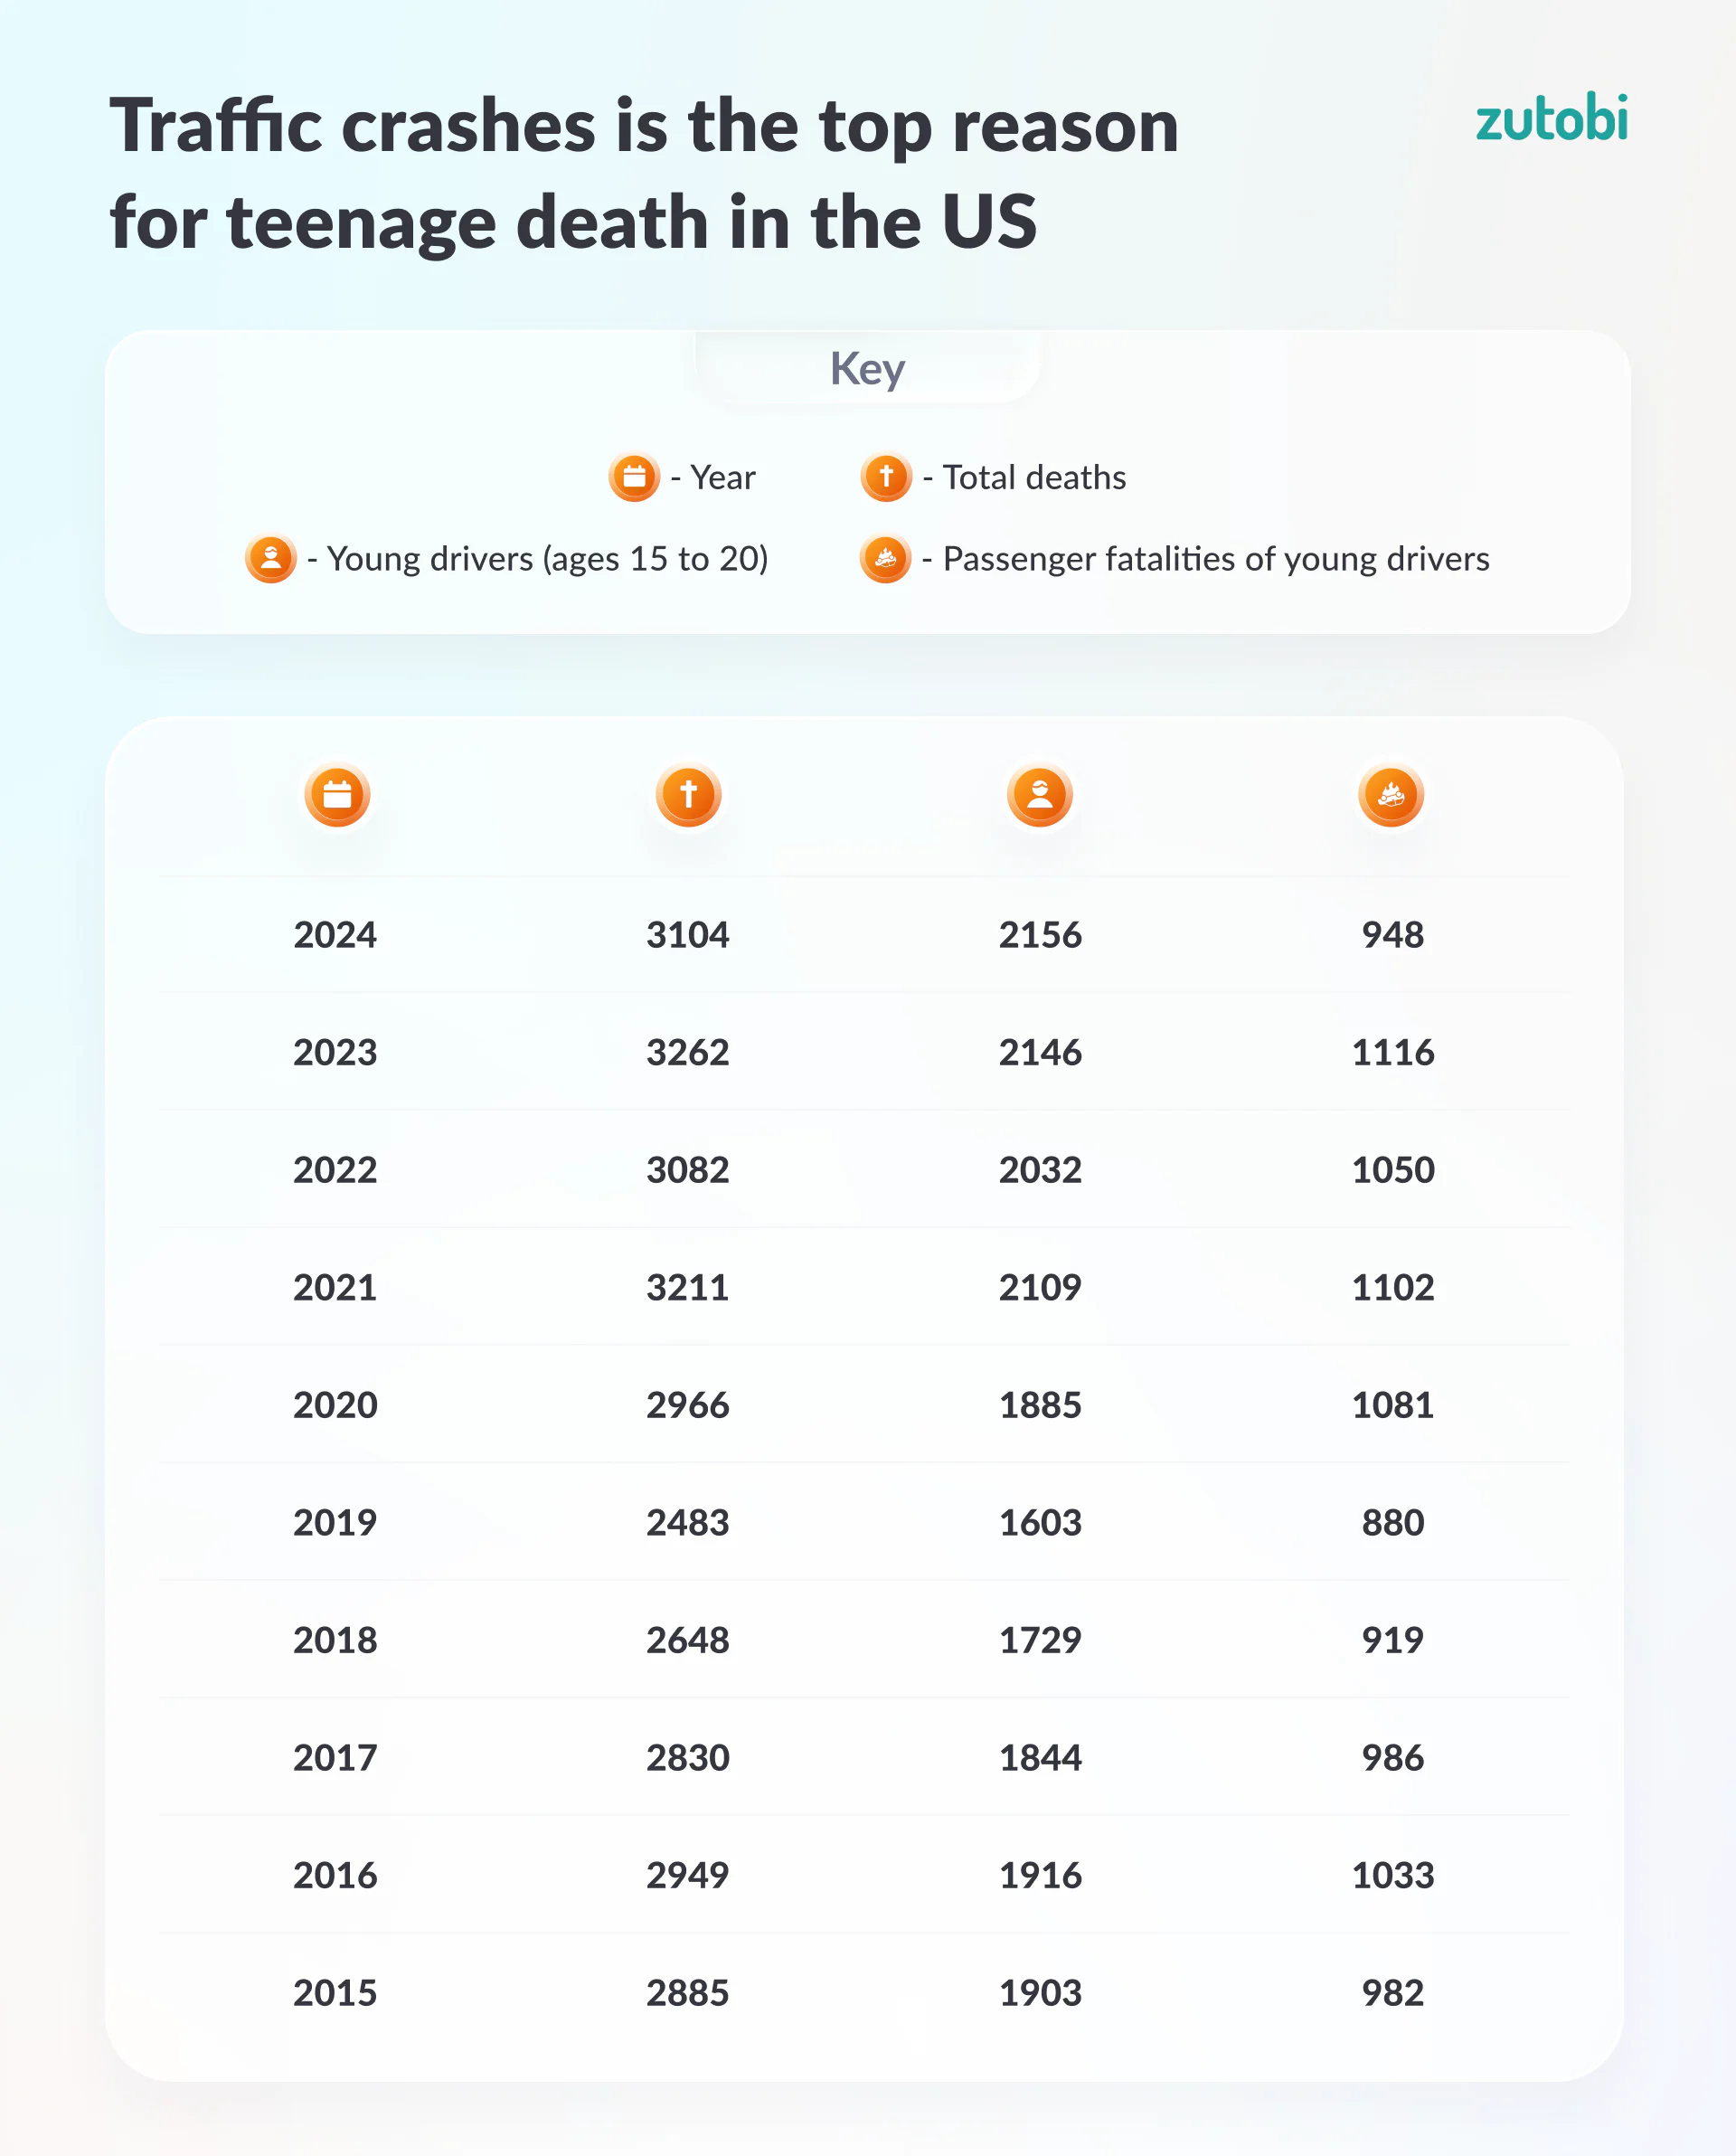
The 2024 number remains alarmingly high
Since 1982, the overall number of teen road fatalities has been declining. But the trend is not linear, there have been fluctuations along the way, including an increase during the pandemic years.
In 2024, 3,104 people were killed in crashes involving a teen driver between the ages of 15 and 20, a 4.8% decrease from the 3,262 recorded in 2023. The decline in total fatalities is largely driven by a drop in passenger deaths, which fell from 1,116 to 948. The number of young drivers killed remained nearly flat, edging up slightly from 2,146 to 2,156. Compared to 2019, the last full pre-pandemic year, the 2024 total remains 25% higher.
| Year | Total deaths | Young drivers (ages 15 to 20) | Passenger fatalities of young drivers |
|---|---|---|---|
| 2024 | 3,104 | 2,156 | 948 |
| 2023 | 3,262 | 2,146 | 1,116 |
| 2022 | 3,082 | 2,032 | 1,050 |
| 2021 | 3,211 | 2,109 | 1,102 |
| 2020 | 2,966 | 1,885 | 1,081 |
| 2019 | 2,483 | 1,603 | 880 |
| 2018 | 2,648 | 1,729 | 919 |
| 2017 | 2,830 | 1,844 | 986 |
| 2016 | 2,949 | 1,916 | 1,033 |
| 2015 | 2,885 | 1,903 | 982 |
| 2014 | 2,738 | 1,723 | 1,015 |
| 2013 | 2,765 | 1,696 | 1,069 |
| 2012 | 2,940 | 1,880 | 1,060 |
| 2011 | 3,187 | 1,993 | 1,194 |
| 2010 | 3,298 | 1,965 | 1,333 |
| 2009 | 3,799 | 2,343 | 1,456 |
| 2008 | 4,404 | 2,742 | 1,662 |
| 2007 | 5,234 | 3,190 | 2,044 |
| 2006 | 5,667 | 3,490 | 2,177 |
| 2005 | 5,671 | 3,474 | 2,197 |
| 2004 | 6,036 | 3,634 | 2,402 |
| 2003 | 6,074 | 3,675 | 2,399 |
| 2002 | 6,403 | 3,838 | 2,565 |
| 2001 | 6,146 | 3,617 | 2,529 |
| 2000 | 6,156 | 3,621 | 2,535 |
| 1999 | 6,142 | 3,564 | 2,578 |
| 1998 | 5,920 | 3,431 | 2,489 |
| 1997 | 5,993 | 3,358 | 2,635 |
| 1996 | 6,024 | 3,389 | 2,635 |
| 1995 | 5,927 | 3,348 | 2,579 |
| 1994 | 5,962 | 3,449 | 2,513 |
| 1993 | 5,670 | 3,228 | 2,442 |
| 1992 | 5,515 | 3,153 | 2,362 |
| 1991 | 6,192 | 3,573 | 2,619 |
| 1990 | 6,836 | 4,053 | 2,783 |
| 1989 | 7,094 | 4,222 | 2,872 |
| 1988 | 7,594 | 4,619 | 2,975 |
| 1987 | 7,541 | 4,582 | 2,959 |
| 1986 | 7,756 | 4,658 | 3,098 |
| 1985 | 6,893 | 4,281 | 2,612 |
| 1984 | 7,309 | 4,525 | 2,784 |
| 1983 | 6,968 | 4,252 | 2,716 |
| 1982 | 7,327 | 4,526 | 2,801 |
What are the main causes of fatal teen driving accidents?
Inexperience alone does not explain why so many teen drivers die. The data consistently points to a cluster of specific behaviors that appear in crash records year after year. Many states have enacted tighter licensing restrictions for new drivers precisely because these behaviors are so predictable, and yet they persist.
Here is where the numbers stand:
- Alcohol Consumption: Although alcohol consumption is illegal for those under 21, it remains a factor in teenage traffic fatalities. In 2024, 661 teen drivers were killed in DUI-related crashes, a 3.8% decline from 687 in 2023. According to research gathered by the Insurance Institute for Highway Safety (IIHS), fatal crash rates among young drivers are higher in places where the minimum drinking age is lower.
- Speeding: Speeding remains the leading cause of fatal teen driving accidents in the United States. In 2024, 1,974 teen drivers lost their lives in speeding-related crashes, a figure that has held stubbornly high, declining just 0.5% from the 1,984 recorded in 2023. Despite ongoing awareness efforts, speed continues to account for the largest share of teen driving fatalities by a significant margin.
- Distracted Driving: Distracted driving accounts for a significant share of teen traffic fatalities each year. In 2024, 315 teen drivers were killed in distracted driving-related crashes, a 9.5% decrease from 348 in 2023. Distracted driving includes texting, calling, eating, talking with passengers, and using navigation apps. According to NHTSA, texting while driving increases a teen’s risk of crashing by 23 times, and dialing a phone increases it by six times.
- Seat Belts: Seat belt use remains inconsistent among teen drivers. According to NHTSA, 51% of teen drivers who died in 2024 were unbuckled, up from 50% in 2023. When the teen driver in a fatal crash was unbuckled, nine out of ten passengers who died were also unbuckled.
| State | Impaired/Drunk Driving | Distracted Driving | Speeding |
|---|---|---|---|
| Alabama | 17 | 2 | 40 |
| Alaska | 1 | 0 | 8 |
| Arizona | 28 | 11 | 93 |
| Arkansas | 8 | 3 | 19 |
| California | 69 | 13 | 183 |
| Colorado | 16 | 6 | 54 |
| Connecticut | 1 | 0 | 19 |
| Delaware | 2 | 1 | 5 |
| District of Columbia | 1 | 0 | 4 |
| Florida | 38 | 21 | 72 |
| Georgia | 15 | 5 | 62 |
| Hawaii | 1 | 6 | 13 |
| Idaho | 4 | 6 | 16 |
| Illinois | 22 | 9 | 70 |
| Indiana | 13 | 5 | 41 |
| Iowa | 4 | 5 | 13 |
| Kansas | 7 | 14 | 13 |
| Kentucky | 7 | 14 | 17 |
| Louisiana | 10 | 19 | 31 |
| Maine | 1 | 0 | 4 |
| Maryland | 8 | 1 | 16 |
| Massachusetts | 7 | 1 | 23 |
| Michigan | 12 | 5 | 39 |
| Minnesota | 6 | 5 | 26 |
| Mississippi | 13 | 2 | 30 |
| Missouri | 20 | 7 | 66 |
| Montana | 6 | 4 | 18 |
| Nebraska | 6 | 0 | 15 |
| Nevada | 11 | 1 | 26 |
| New Hampshire | 0 | 0 | 10 |
| New Jersey | 6 | 20 | 27 |
| New Mexico | 9 | 11 | 30 |
| New York | 14 | 4 | 53 |
| North Carolina | 25 | 2 | 122 |
| North Dakota | 1 | 1 | 2 |
| Ohio | 19 | 5 | 34 |
| Oklahoma | 12 | 8 | 45 |
| Oregon | 10 | 1 | 25 |
| Pennsylvania | 7 | 4 | 58 |
| Rhode Island | 0 | 0 | 2 |
| South Carolina | 27 | 4 | 54 |
| South Dakota | 1 | 3 | 5 |
| Tennessee | 22 | 6 | 41 |
| Texas | 93 | 49 | 262 |
| Utah | 3 | 1 | 16 |
| Vermont | 5 | 1 | 7 |
| Virginia | 18 | 4 | 45 |
| Washington | 16 | 14 | 51 |
| West Virginia | 7 | 0 | 8 |
| Wisconsin | 10 | 10 | 37 |
| Wyoming | 2 | 1 | 4 |
| Total | 661 | 315 | 1,974 |
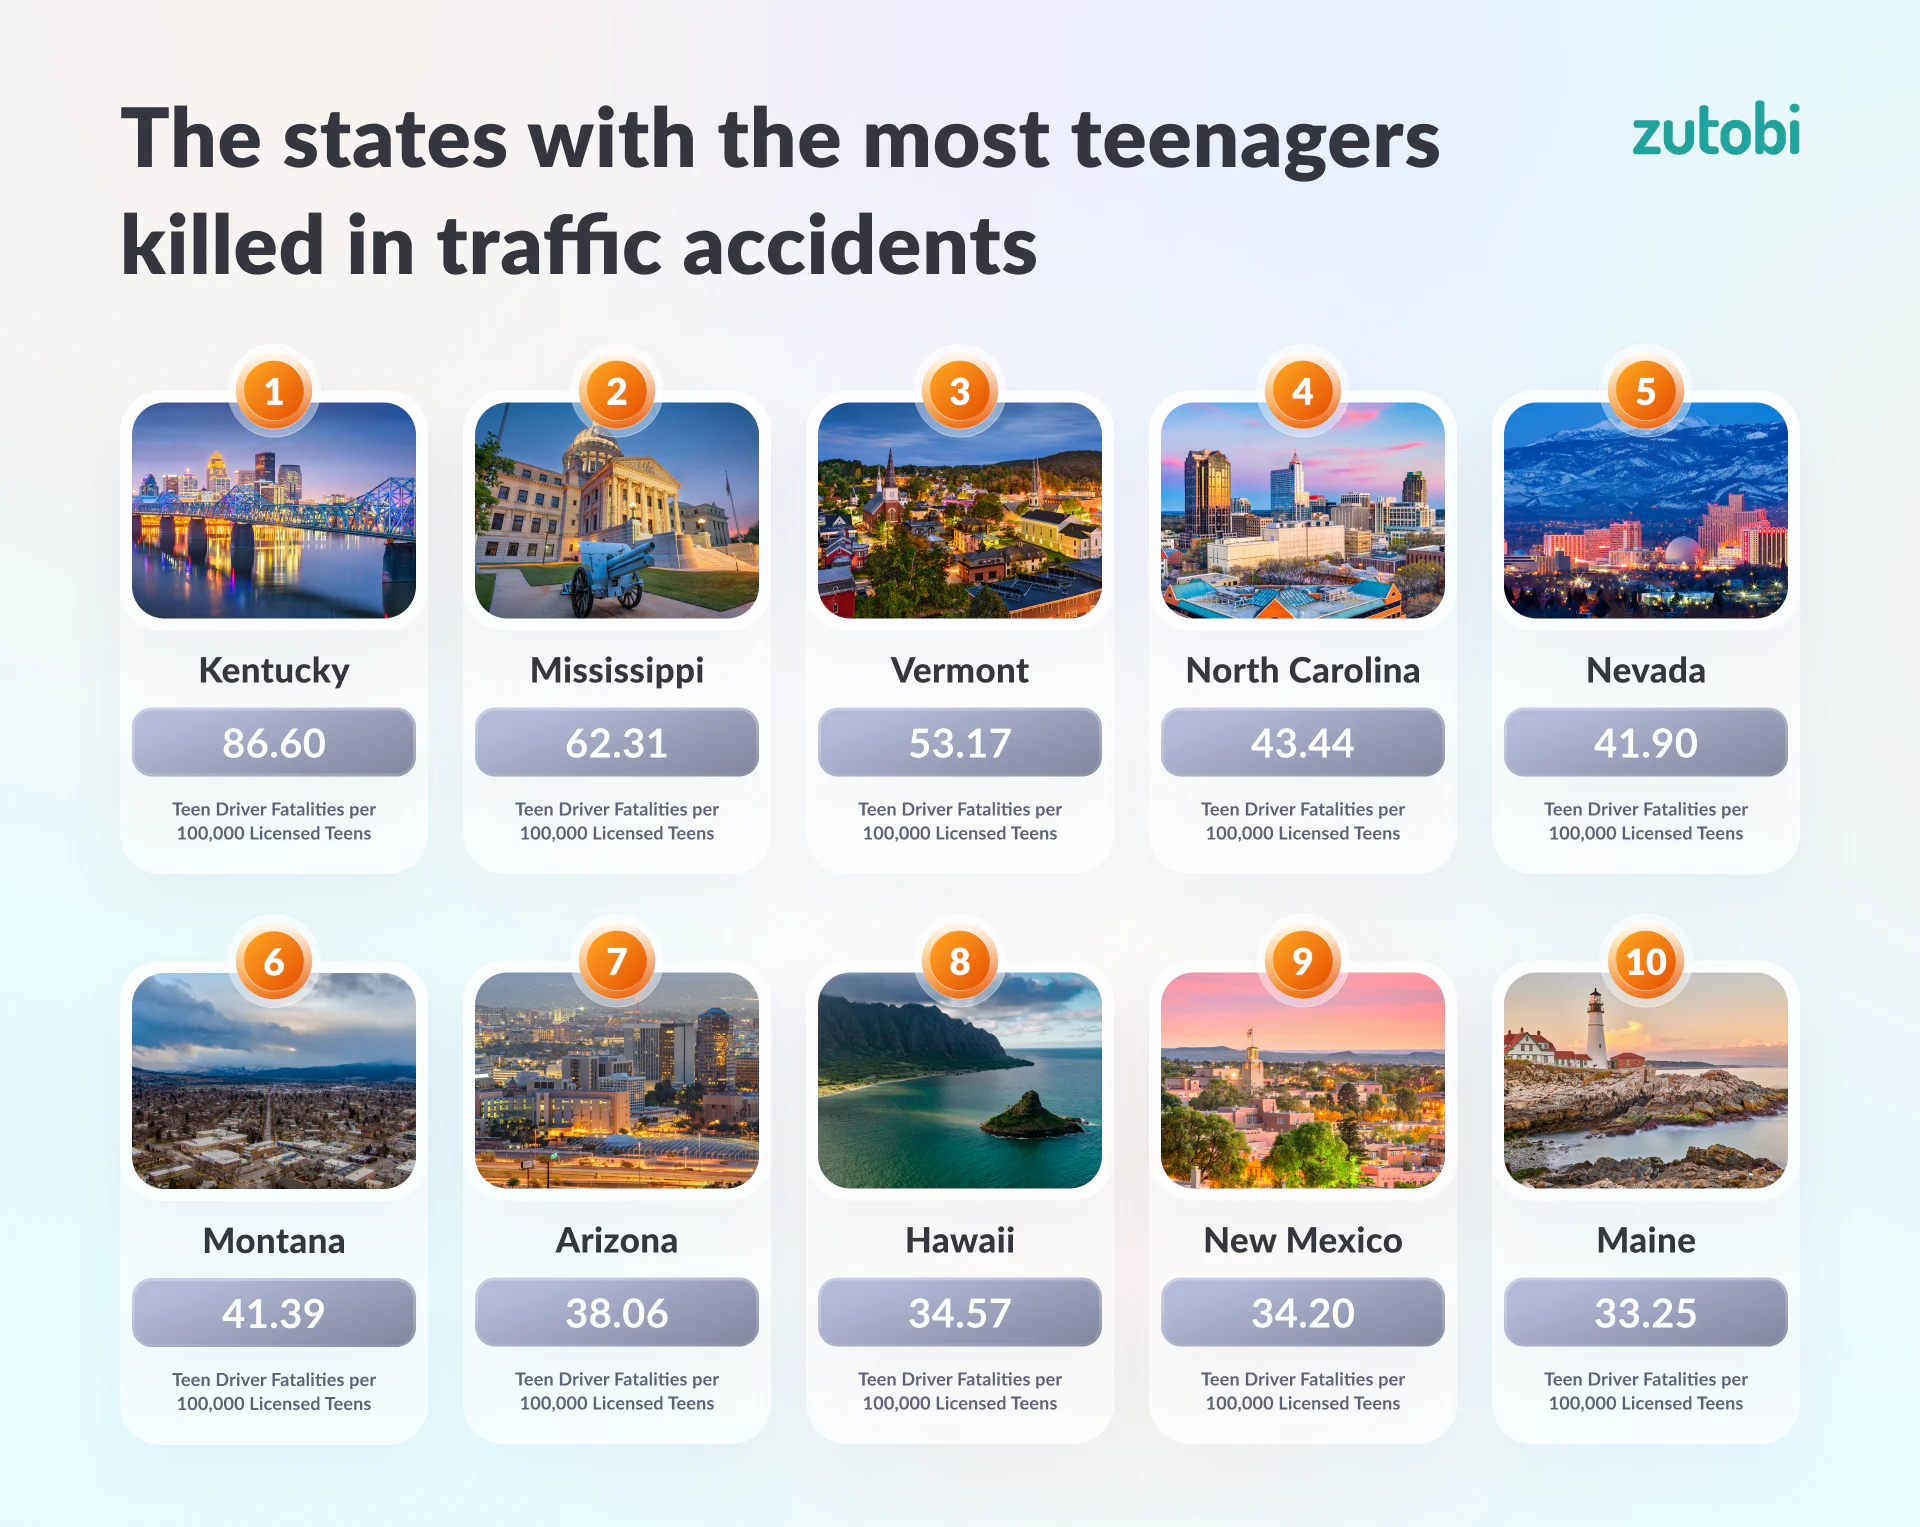
The states with the most teenagers killed in traffic accidents
Kentucky has the most teenage driving fatalities of any state for another year, recording 86.60 deaths per 100,000 teenage drivers in 2024. That figure is a notable improvement from its 2023 rate of 114.25, but it still places Kentucky in a category of its own: nearly 25 points ahead of the second-ranked state.
Mississippi comes in second at 62.31, followed by Vermont (53.17), North Carolina (43.44), Nevada (41.90), Montana (41.39), Arizona (38.06), Hawaii (34.57), New Mexico (34.20), and Maine (33.25).
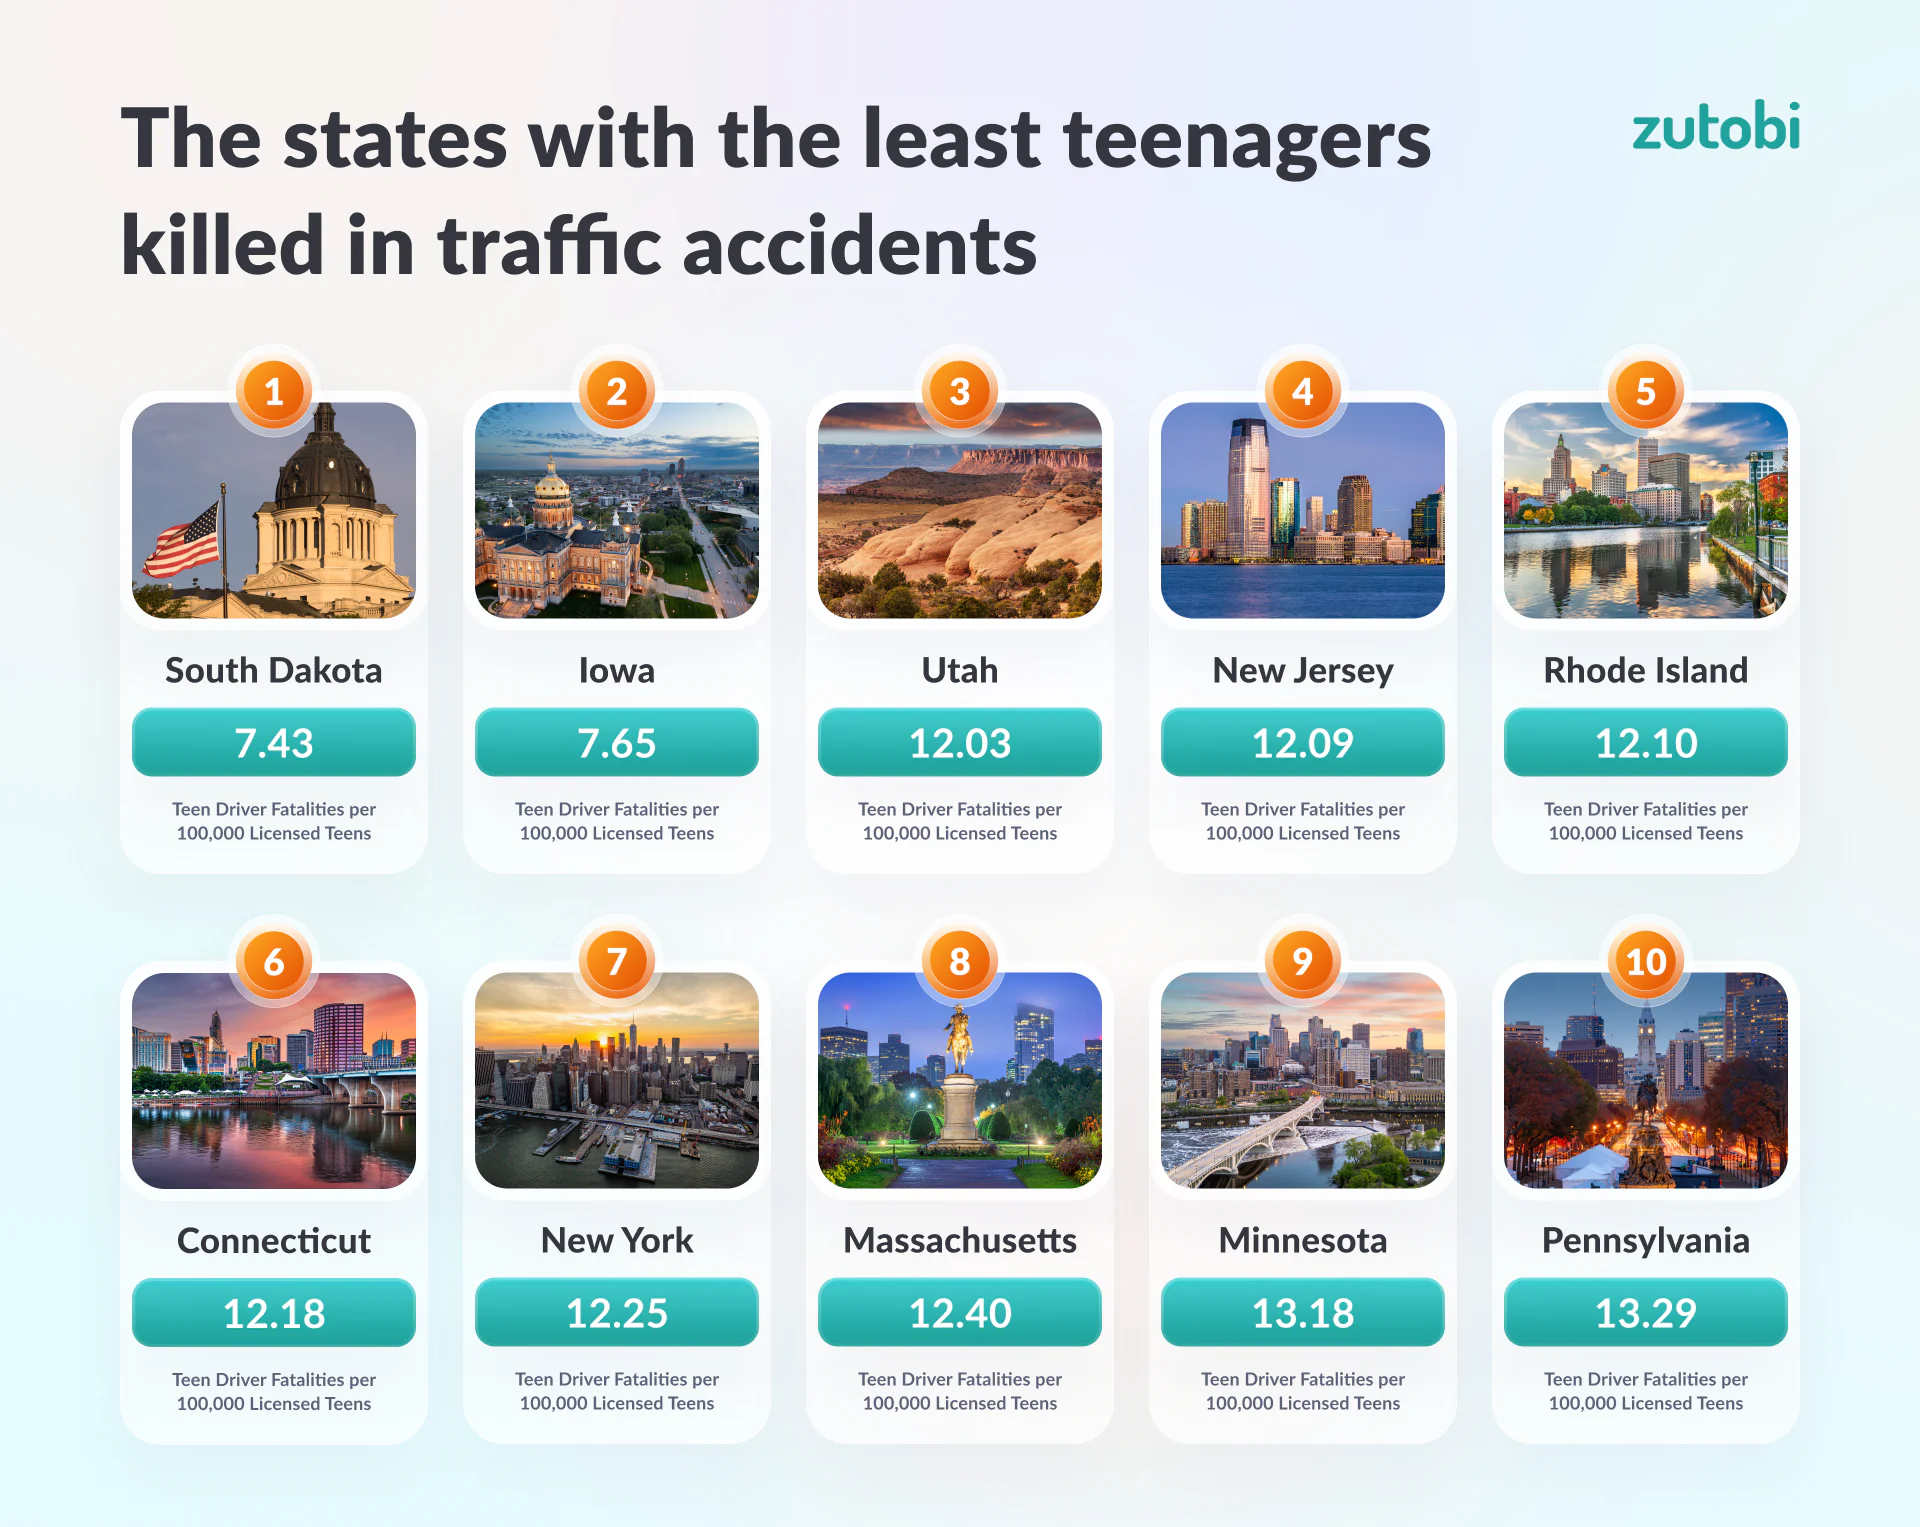
The states with the least teenagers killed in traffic accidents
South Dakota claims the lowest teen driving fatality rate, with 7.43 deaths per 100,000 teenage drivers, edging out Iowa (7.65) for the top spot. Utah (12.03), New Jersey (12.09), Rhode Island (12.10), Connecticut (12.18), New York (12.25), Massachusetts (12.40), Minnesota (13.18), and Pennsylvania (13.29) round out the ten safest states.
The Northeast corridor continues to produce some of the country’s lowest teen driver fatality rates. Several of these states also have the largest teen driver populations, demonstrating that scale is not an obstacle to safety when the right systems are in place.
The complete list of teenage traffic fatalities, by state
| State | Male Teen Drivers Killed | Female Teen Drivers Killed | Total Killed | Fatalities per 100,000 Licensed Teens |
|---|---|---|---|---|
| Kentucky | 24 | 6 | 30 | 86.60 |
| Mississippi | 41 | 13 | 54 | 62.31 |
| Vermont | 8 | 1 | 9 | 53.17 |
| North Carolina | 76 | 21 | 97 | 43.44 |
| Nevada | 25 | 2 | 27 | 41.90 |
| Montana | 13 | 5 | 18 | 41.39 |
| Arizona | 56 | 12 | 68 | 38.06 |
| Hawaii | 8 | 1 | 9 | 34.57 |
| New Mexico | 17 | 3 | 20 | 34.20 |
| Maine | 9 | 3 | 12 | 33.25 |
| Texas | 204 | 49 | 253 | 33.04 |
| Tennessee | 58 | 13 | 71 | 32.11 |
| Idaho | 18 | 8 | 26 | 31.35 |
| Colorado | 39 | 11 | 50 | 30.26 |
| Missouri | 45 | 13 | 58 | 29.05 |
| Wyoming | 5 | 2 | 7 | 28.32 |
| Florida | 120 | 20 | 140 | 28.07 |
| Louisiana | 26 | 8 | 34 | 27.97 |
| West Virginia | 11 | 4 | 15 | 27.42 |
| New Hampshire | 9 | 1 | 10 | 26.60 |
| Oklahoma | 28 | 6 | 34 | 26.48 |
| Alabama | 47 | 10 | 57 | 26.36 |
| Maryland | 24 | 4 | 28 | 26.10 |
| Oregon | 25 | 5 | 30 | 25.86 |
| Indiana | 42 | 9 | 51 | 25.39 |
| South Carolina | 46 | 12 | 58 | 24.48 |
| California | 175 | 22 | 197 | 24.34 |
| Kansas | 25 | 2 | 27 | 24.33 |
| Virginia | 40 | 8 | 48 | 21.38 |
| Nebraska | 16 | 3 | 19 | 21.68 |
| Georgia | 58 | 9 | 67 | 20.35 |
| Washington | 33 | 11 | 44 | 20.03 |
| Illinois | 56 | 19 | 75 | 18.75 |
| Michigan | 40 | 13 | 53 | 18.30 |
| Arkansas | 18 | 10 | 28 | 18.12 |
| Wisconsin | 25 | 10 | 35 | 18.05 |
| North Dakota | 6 | 0 | 6 | 17.99 |
| Delaware | 7 | 0 | 7 | 17.49 |
| Ohio | 50 | 10 | 60 | 16.62 |
| Alaska | 2 | 1 | 3 | 13.99 |
| Pennsylvania | 37 | 4 | 41 | 13.29 |
| Minnesota | 28 | 5 | 33 | 13.18 |
| Massachusetts | 16 | 4 | 20 | 12.40 |
| New York | 40 | 6 | 46 | 12.25 |
| Connecticut | 10 | 1 | 11 | 12.18 |
| Rhode Island | 3 | 0 | 3 | 12.10 |
| New Jersey | 27 | 2 | 29 | 12.09 |
| Utah | 15 | 4 | 19 | 12.03 |
| Iowa | 10 | 5 | 15 | 7.65 |
| South Dakota | 3 | 1 | 4 | 7.43 |
Improved states and states heading in the wrong direction
The national total masks a sharp divide at the state level. In 2024, some states made genuine, measurable progress on teen driver safety. Others moved in the opposite direction. Below is the full picture of which states improved the most and which require the most urgent attention, based on year-over-year changes in fatality rates per 100,000 licensed teen drivers.
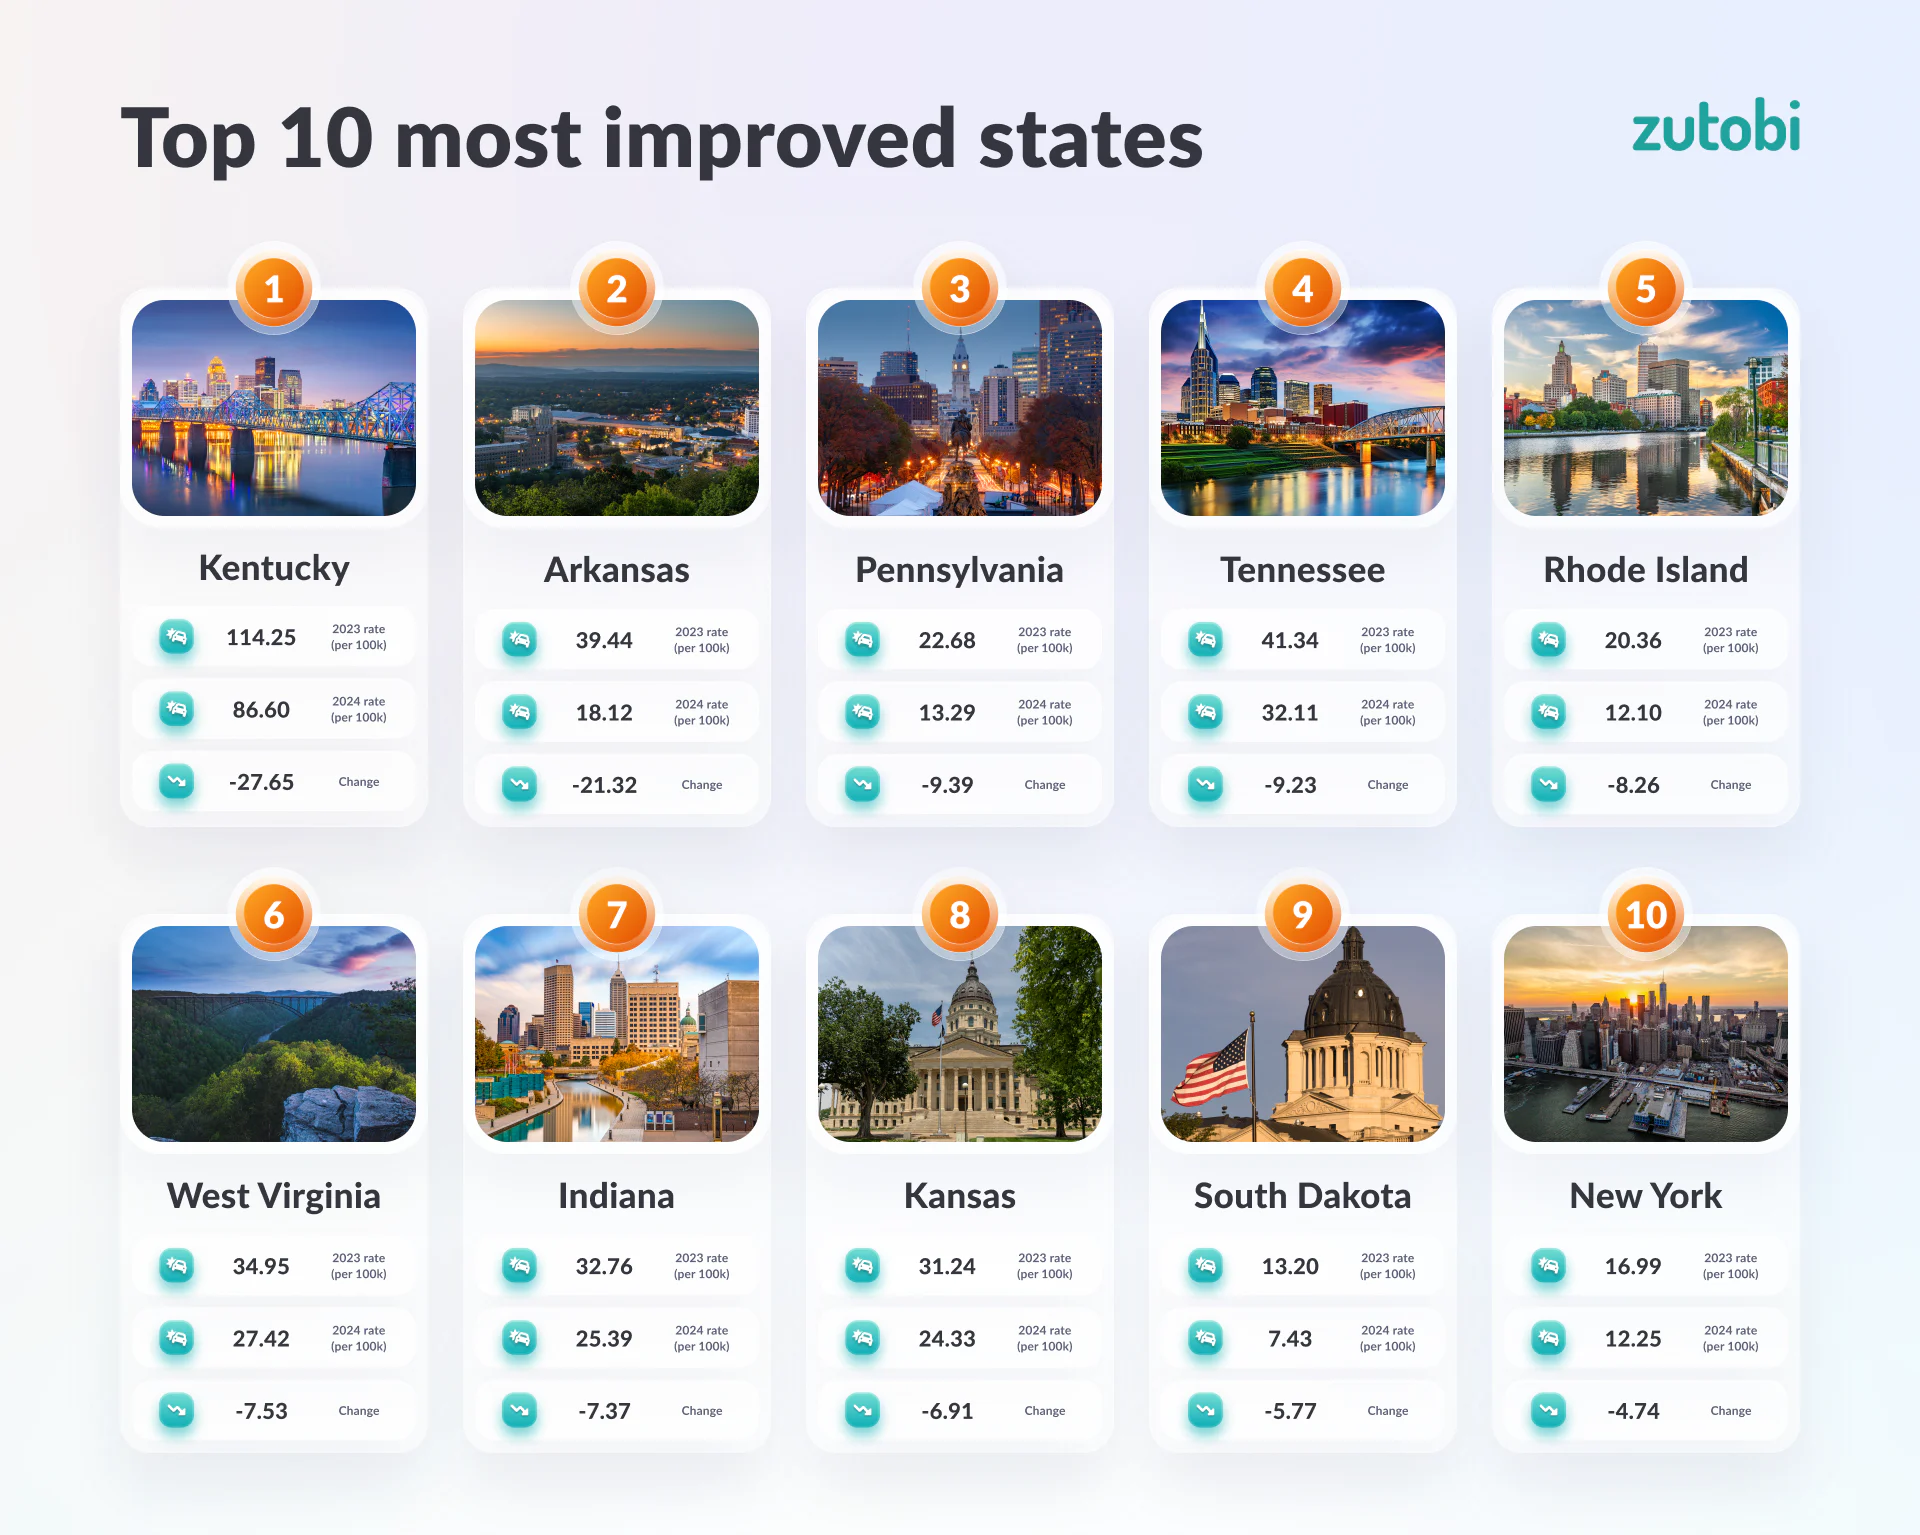
Kentucky recorded the largest year-over-year improvement in 2024. A drop of nearly 28 points per 100,000 is substantial. It does not close the gap between Kentucky and the rest of the country but it shows that the gap can be narrowed. Arkansas went further still, cutting its rate by more than half. South Dakota’s decline carried it all the way to the lowest teen driver fatality rate in the country, and Rhode Island moved out of the middle of the pack.
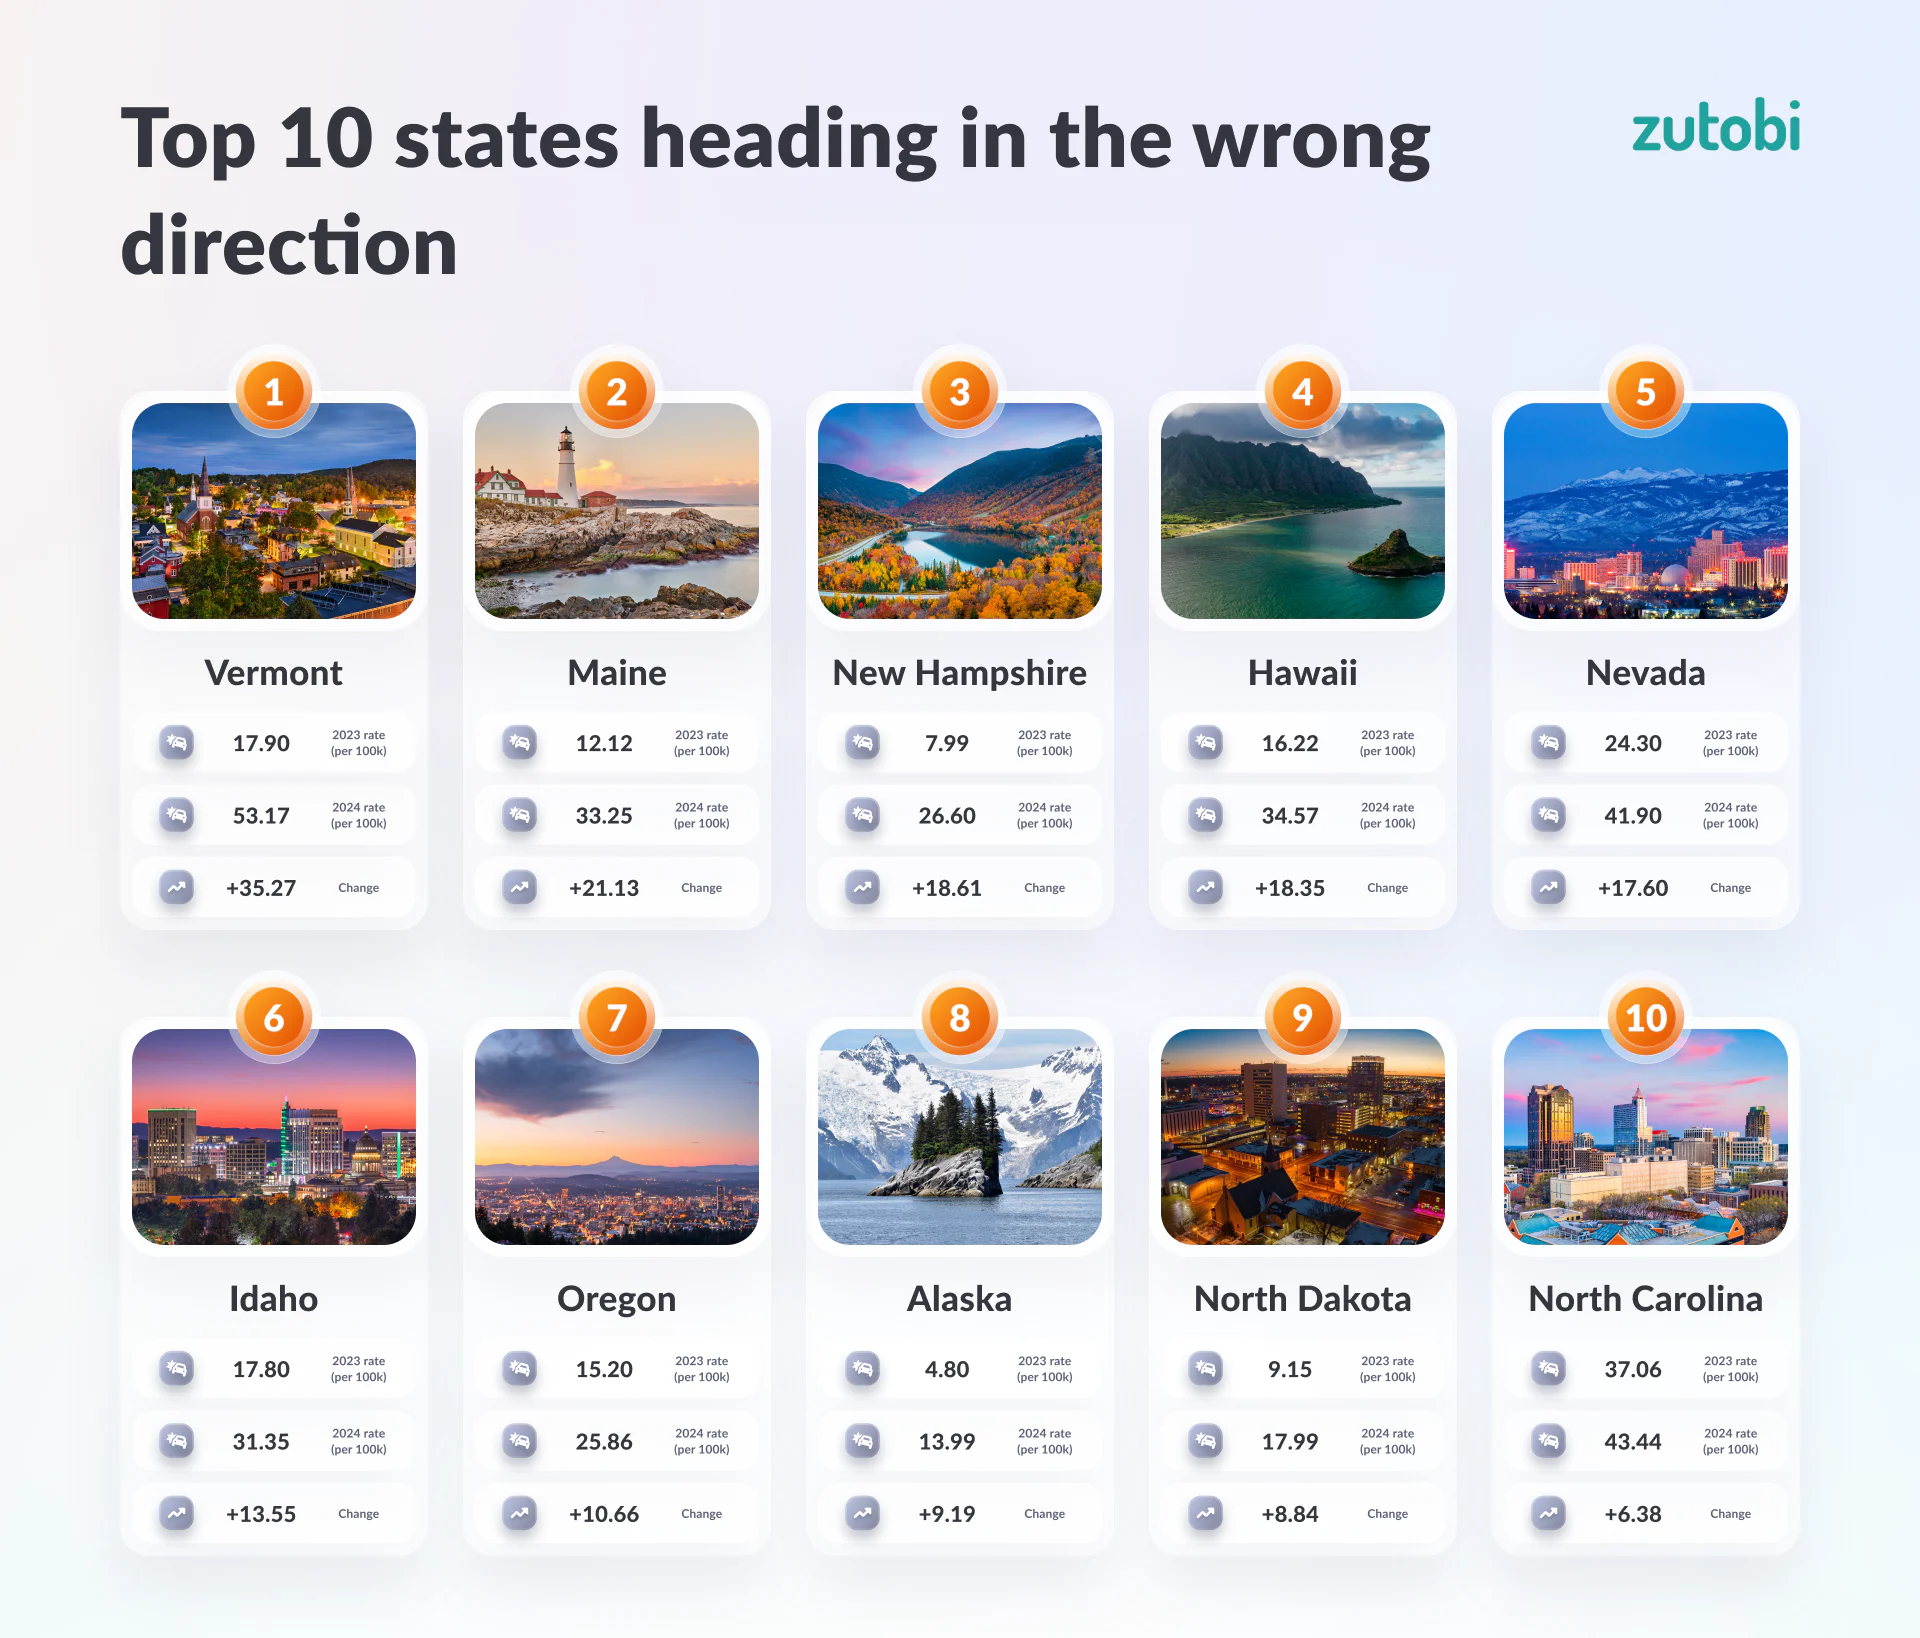
Vermont’s rate increased from 17.90 to 53.17 per 100,000, the steepest jump in the country. The same dynamic drives much of this list. Maine (four deaths to twelve), New Hampshire (three to ten), Hawaii (four to nine), and Alaska (one to three) all posted some of the sharpest rate increases off small absolute counts, where a handful of additional deaths produces an outsized swing per 100,000. Nevada is the exception in scale, with its rate climbing roughly 70% on a larger base, while North Carolina is the only state on the list and saw a more modest increase.
How can this be improved?
Teen driving deaths cluster around specific behaviors and gaps in how we prepare young people to drive. That means they are preventable, with the right tools.
“The overall numbers are moving in the right direction, but 3,000 deaths a year is still far too many,” says Lucas Waldenback, co-founder of Zutobi, a leading EdTech company in driver’s education. “There is clearly more work to be done.”
The answer, Waldenback argues, lies in closing the gap between how driver education is taught and how young people learn. Traditional classroom instruction was designed for a generation that no longer exists. Zutobi’s approach replaces it with video lessons, real-time hazard perception training, and quizzes that respond to where each student is struggling. It gives teens the feedback loop that builds judgment and knowledge.
Parents also play a significant role in teen driver safety. Study after study shows that teens with highly engaged parents behind the wheel during supervised practice are meaningfully safer drivers once they go solo. Zutobi’s Parent-Teen Training Guide was built specifically to make those practice sessions structured and effective, giving parents a clear curriculum instead of leaving them to improvise in a parking lot.
“Today’s learners need shorter feedback loops, real-time assessment, and parental involvement built into the process,” Waldenback adds. “That is exactly what Zutobi was built to deliver, and the data on teen driver safety makes clear why it matters.”
Previous reports
Methodology
Most of the injury data has been gathered using the NHTSA crash data tool, and the Fatality and Injury Reporting System (FIRST). To find the number of licensed teen drivers, we looked at data from the Federal Highway Administration.
Take our full course with tests and theory
600+ exam-like questions and practice tests
Easy summarized DMV handbook
America’s #1 driver’s ed app with a 95.8% pass rate
Recommended articles


Ace your DMV test, guaranteed
Want to Be the Top School in Your Area?
- Simple & automated admin
- More time for teaching
- #1 learning materials for students
Start learning now
Resources
- Driver’s License Renewal
- How to Get Your US Driver’s License
- How to Prepare for Your Road Test
- How to Get a Driver’s Permit
- Behind-The-Wheel training
- Courses
- Blog
- FAQ
Show More
©2026 Zutobi AB, 4 Peddlers Row, Unit #103, Newark, DE 19702