loved by
15.1+ million
users
The EV Miles Report 2026

Which electric vehicle is the most economical to charge and drive? And in which state is it cheapest to run an EV?
Electric vehicles made up 7.8% of new car sales in the US in 2025, down slightly from 8.1% in 2024. The first annual dip in years, as buyers weigh higher upfront prices and charging costs more carefully. With that scrutiny in mind, this report uses 2025 electricity pricing and manufacturer vehicle specs to work out exactly what it costs to drive an EV, model by model and state by state, and how those costs have moved since 2022.
For those who’ve recently passed their driving test or are considering a vehicle upgrade, understanding the economic landscape of electric vehicles is crucial. Cost efficiency can vary significantly between models and regions, influenced by local electricity rates, state incentives, and available infrastructure, creating a complex decision-making process for potential buyers.
Our updated report reflects current electricity rates, recent technological advancements in battery efficiency, and the latest vehicle offerings, giving you the most accurate picture of EV economics in today’s market.
The Top Three Cheapest Electric Vehicles to Run in 2025
In this section, we’ll look at the most efficient electric vehicles to run, ranked according to how much it would cost to drive them 100 miles. Energy rates vary by state so we have used national energy prices to calculate this ranking.
1. Tesla Model 3 Long Range
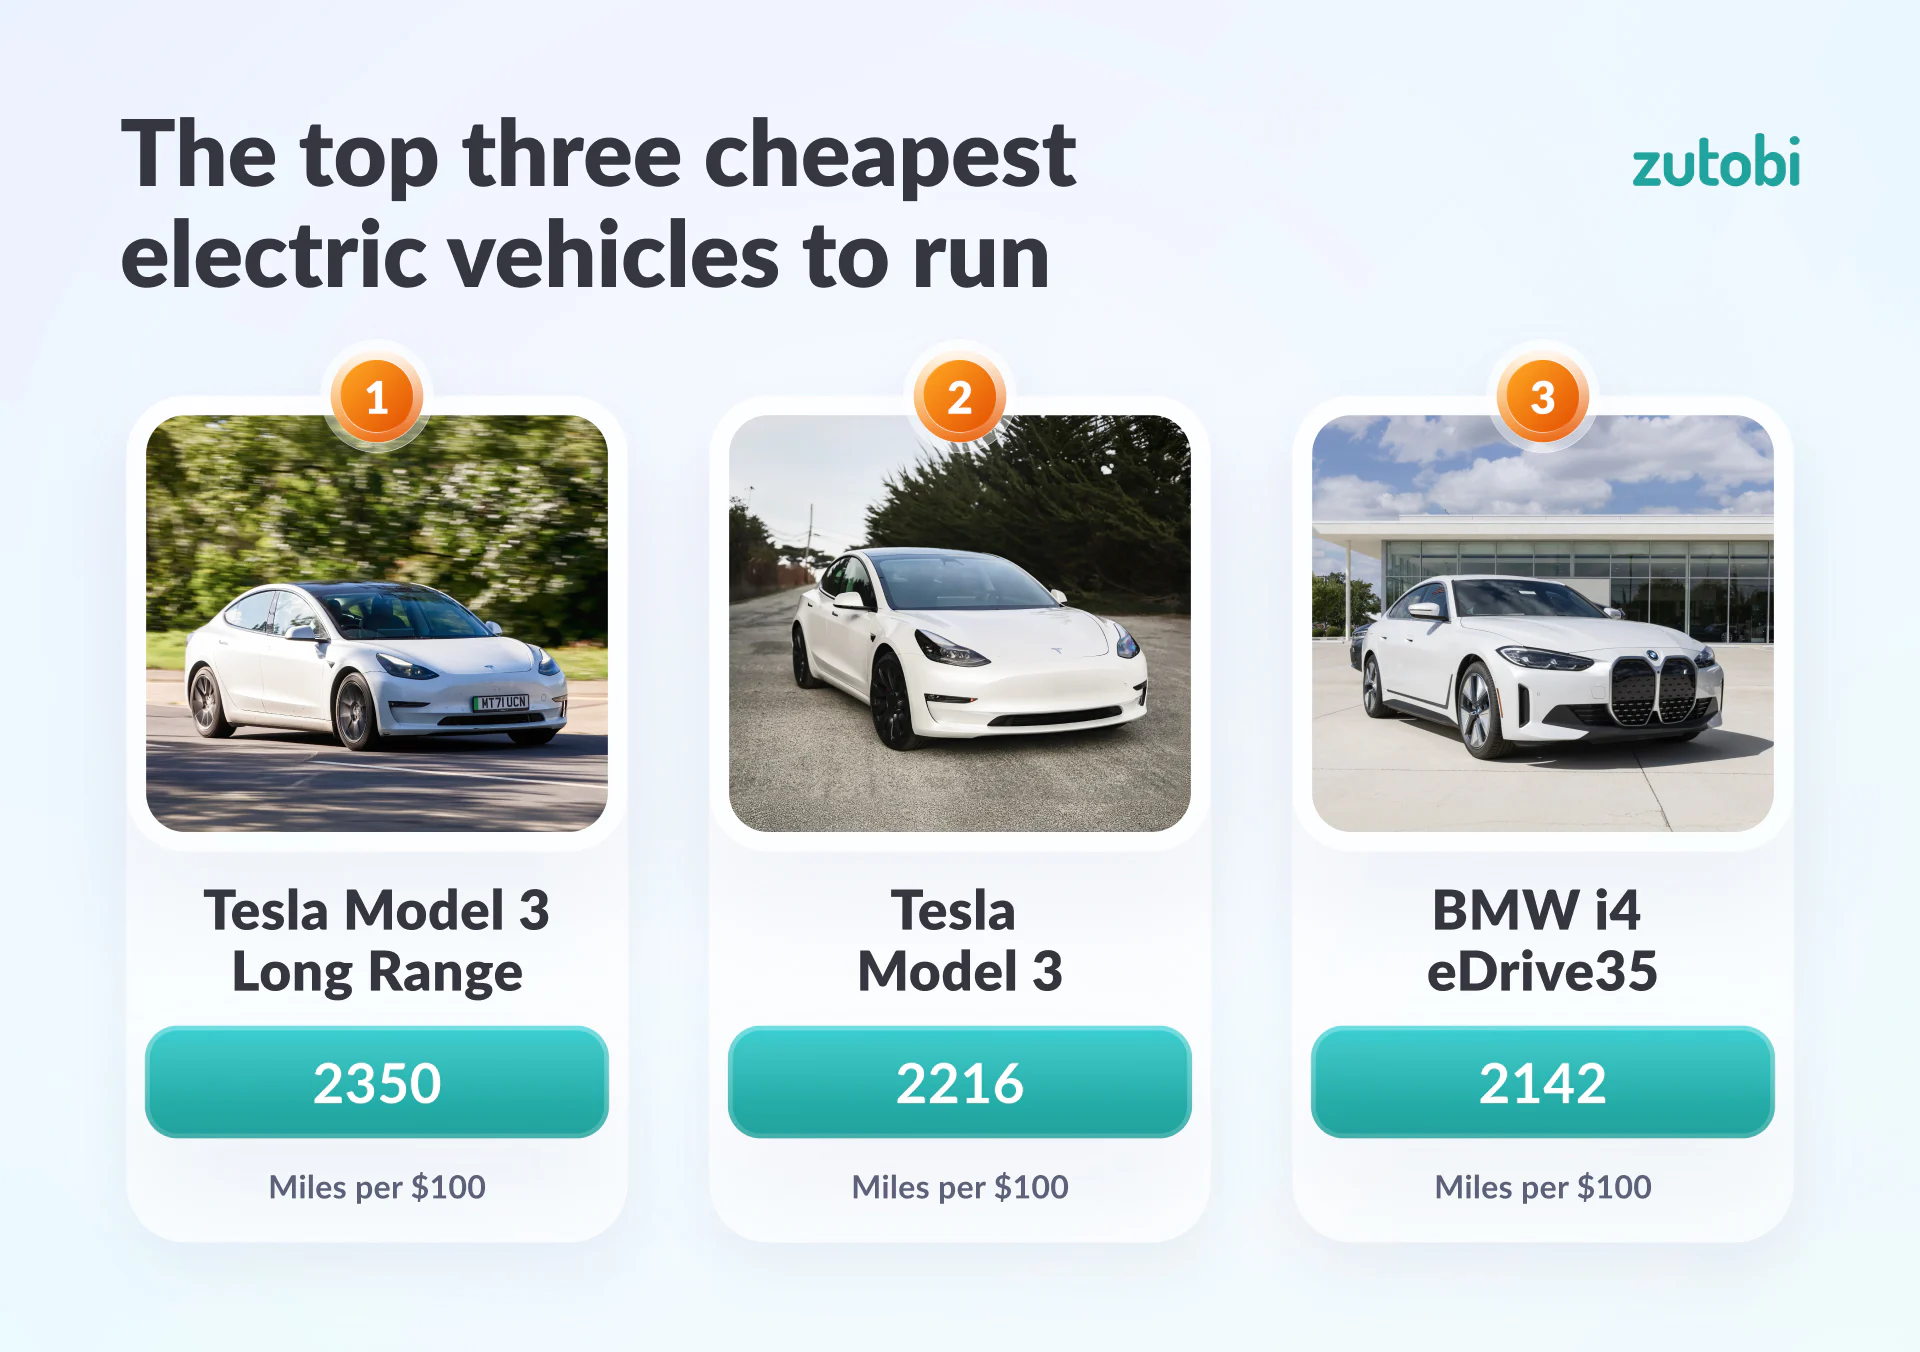
The Tesla Model 3 Long Range is the most economical electric vehicle to drive in 2025. With a usable battery capacity of 75 kWh and a real-world range of 325 miles, it costs just $4.26 to drive 100 miles. That translates to 2,350 miles per $100 of electricity, the best efficiency of any EV assessed.
2. Tesla Model 3
Just behind it is the standard Tesla Model 3, with a smaller 57.5 kWh battery and a real-world range of 235 miles. It costs $4.51 to drive 100 miles, still a strong 2,216 miles per $100.
3. BMW i4 eDrive35
Rounding out the top three is the BMW i4 eDrive35, with a 67.1 kWh battery and a real-world range of 265 miles. Drivers can expect to pay $4.67 per 100 miles, equating to 2,142 miles per $100, a solid choice for those seeking a non-Tesla EV without giving up efficiency.
Electric Vehicles Ranked by Cost to Run
| Rank | Make and Model | Real Range (mi) | Cost to Charge | Cost / Mile | Cost / 10 mi | Cost / 100 mi | Miles per $100 |
|---|---|---|---|---|---|---|---|
| 1 | Tesla Model 3 Long Range | 325 | $13.83 | $0.043 | $0.43 | $4.26 | 2,350 |
| 2 | Tesla Model 3 | 235 | $10.60 | $0.045 | $0.45 | $4.51 | 2,216 |
| 3 | BMW i4 eDrive35 | 265 | $12.37 | $0.047 | $0.47 | $4.67 | 2,142 |
| 4 | Tesla Model 3 Performance | 285 | $14.01 | $0.049 | $0.49 | $4.92 | 2,034 |
| 5 | Tesla Model S Dual Motor | 355 | $17.52 | $0.049 | $0.49 | $4.93 | 2,026 |
| 6 | Tesla Model Y Long Range | 280 | $13.83 | $0.049 | $0.49 | $4.94 | 2,025 |
| 7 | Lucid Air Grand Touring | 415 | $20.65 | $0.050 | $0.50 | $4.98 | 2,009 |
| 8 | Hyundai Kona Electric | 240 | $12.06 | $0.050 | $0.50 | $5.02 | 1,990 |
| 9 | Porsche Taycan Plus | 355 | $17.89 | $0.050 | $0.50 | $5.04 | 1,985 |
| 10 | Hyundai IONIQ 6 Long Range AWD | 270 | $13.65 | $0.051 | $0.51 | $5.05 | 1,979 |
The Three Best States for Running an EV in 2025
Here we consider the difference in cost for running an electric vehicle in different parts of the country. By comparing energy prices in each state and using a Tesla Model 3 as our example EV, we can reveal the cheapest states for owning and running an electric car.
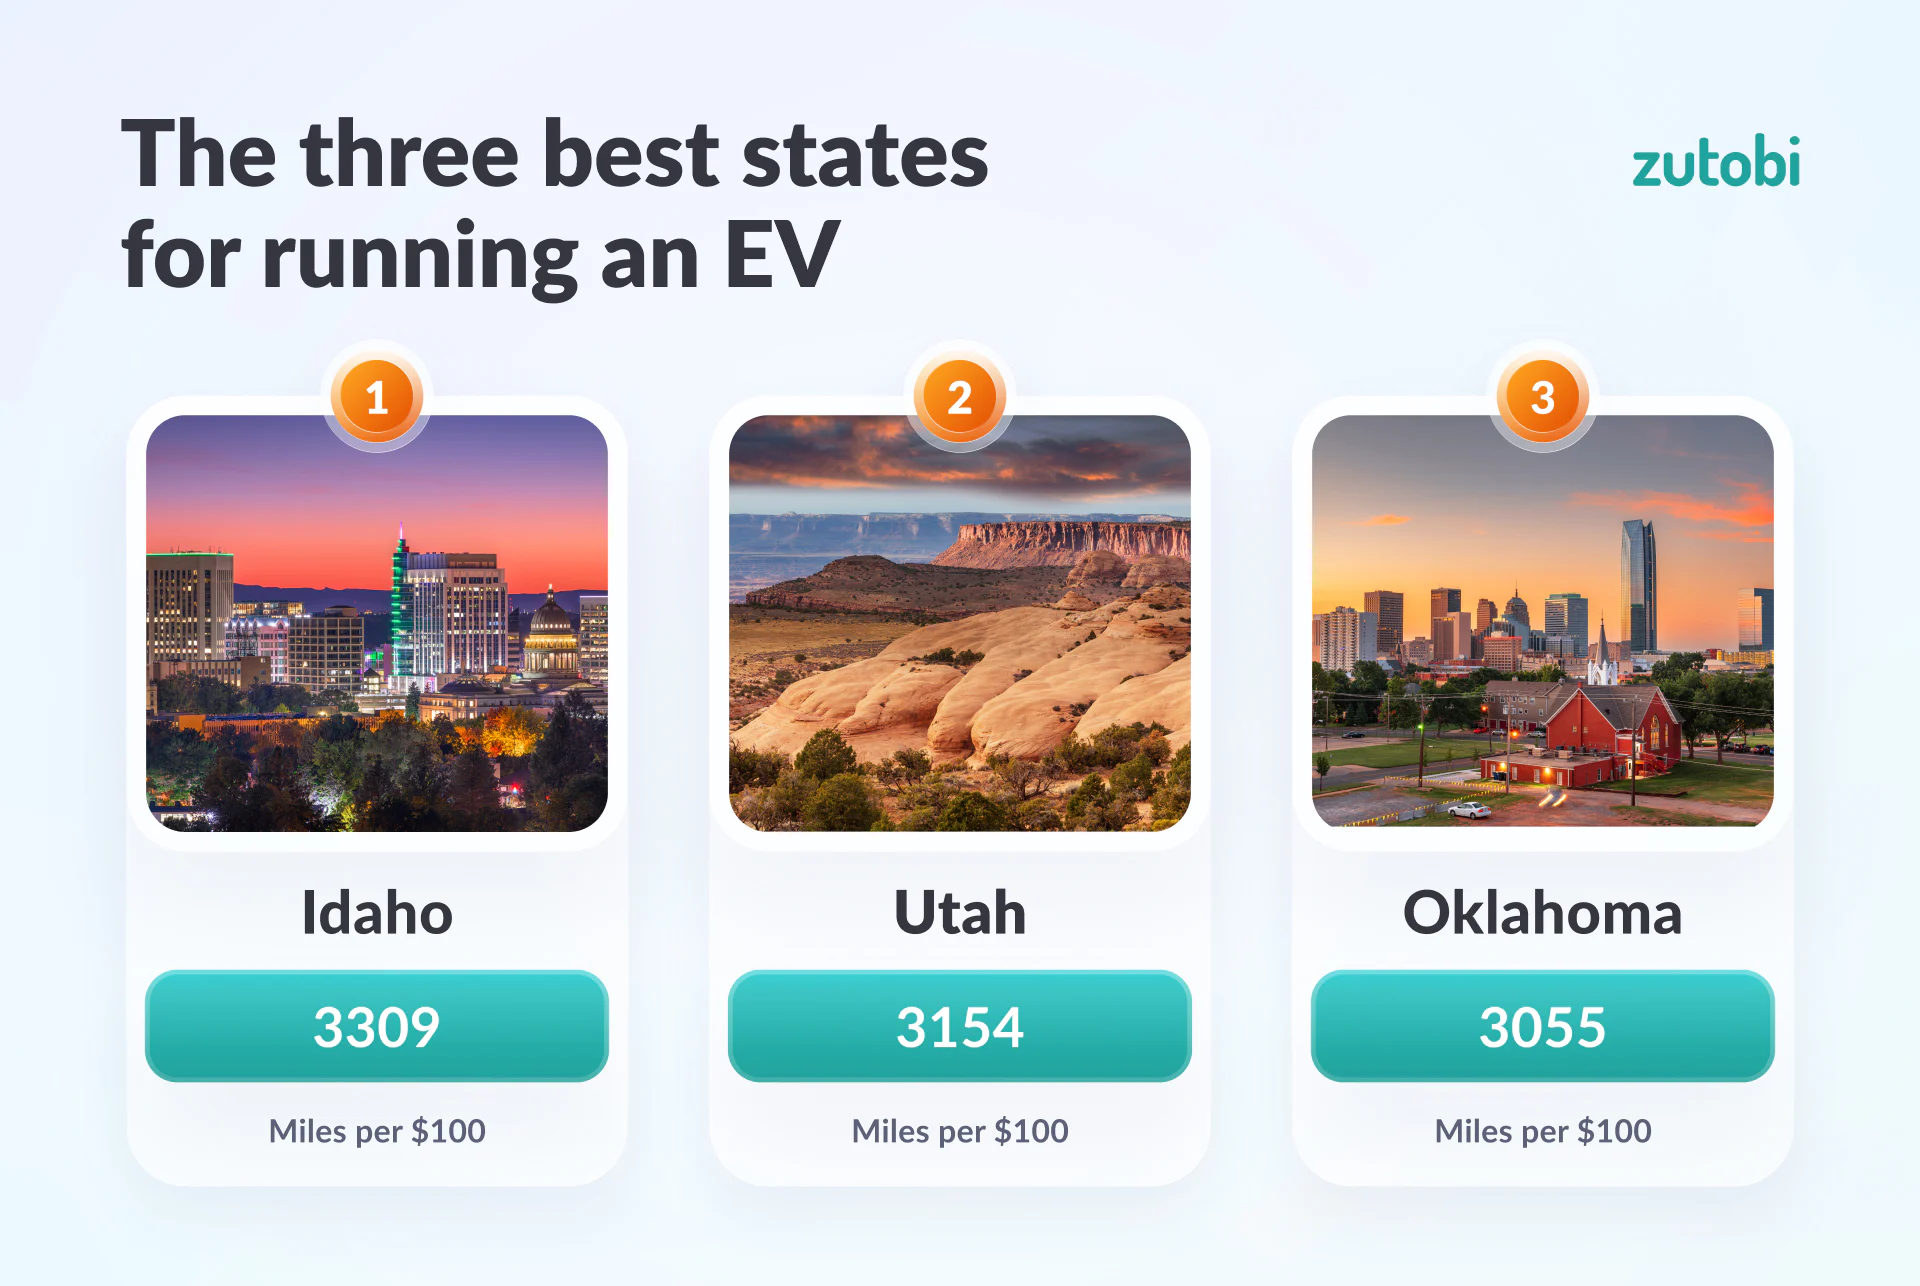
Idaho is the best state for running electric vehicles, with Tesla Model 3 owners able to get approximately 3,309 miles out of a $100 charge. That’s 33 miles for every dollar. However, hot on their heels is Utah where owners can travel 3,154 miles per $100, followed by Oklahoma with 3,055 miles per $100.
In Idaho, you can charge up your Tesla Model 3 for just $7.10, which is slightly cheaper than Utah at $7.45 and Oklahoma at $7.69. In every other state, this cost would be above $7.81, with the cost in 21 states being over $10. The most expensive state to charge a Tesla Model 3 is Hawaii, where it would cost $29.90, though this is still much cheaper than it would cost to fill up a comparable car with gas.
The Cost to Drive a Tesla in Each US State (2025)
| Rank | State | Avg. Electricity Price / kWh | Cost to Charge | Cost / Mile | Cost / 10 mi | Cost / 100 mi | Miles per $100 |
|---|---|---|---|---|---|---|---|
| 1 | Idaho | $0.123 | $7.10 | $0.030 | $0.30 | $3.02 | 3,309 |
| 2 | Utah | $0.130 | $7.45 | $0.032 | $0.32 | $3.17 | 3,154 |
| 3 | Oklahoma | $0.134 | $7.69 | $0.033 | $0.33 | $3.27 | 3,055 |
| 4 | Nebraska | $0.136 | $7.81 | $0.033 | $0.33 | $3.33 | 3,007 |
| 5 | Nevada | $0.136 | $7.82 | $0.033 | $0.33 | $3.33 | 3,005 |
| 6 | North Dakota | $0.136 | $7.83 | $0.033 | $0.33 | $3.33 | 3,003 |
| 7 | Missouri | $0.137 | $7.87 | $0.033 | $0.33 | $3.35 | 2,988 |
| 8 | New Mexico | $0.141 | $8.12 | $0.035 | $0.35 | $3.45 | 2,894 |
| 9 | Iowa | $0.141 | $8.13 | $0.035 | $0.35 | $3.46 | 2,890 |
| 10 | Louisiana | $0.141 | $8.14 | $0.035 | $0.35 | $3.46 | 2,888 |
| 11 | Arkansas | $0.144 | $8.26 | $0.035 | $0.35 | $3.51 | 2,846 |
| 12 | Tennessee | $0.145 | $8.32 | $0.035 | $0.35 | $3.54 | 2,824 |
| 13 | Montana | $0.147 | $8.44 | $0.036 | $0.36 | $3.59 | 2,786 |
| 14 | Wyoming | $0.148 | $8.51 | $0.036 | $0.36 | $3.62 | 2,761 |
| 15 | Washington | $0.149 | $8.60 | $0.037 | $0.37 | $3.66 | 2,734 |
| 16 | Kentucky | $0.150 | $8.61 | $0.037 | $0.37 | $3.67 | 2,728 |
| 17 | North Carolina | $0.151 | $8.68 | $0.037 | $0.37 | $3.69 | 2,708 |
| 18 | Kansas | $0.151 | $8.70 | $0.037 | $0.37 | $3.70 | 2,701 |
| 19 | Florida | $0.152 | $8.72 | $0.037 | $0.37 | $3.71 | 2,694 |
| 20 | Arizona | $0.152 | $8.76 | $0.037 | $0.37 | $3.73 | 2,683 |
| 21 | South Dakota | $0.157 | $9.04 | $0.038 | $0.38 | $3.85 | 2,598 |
| 22 | Georgia | $0.158 | $9.11 | $0.039 | $0.39 | $3.88 | 2,580 |
| 23 | Colorado | $0.162 | $9.29 | $0.040 | $0.40 | $3.95 | 2,529 |
| 23 | Mississippi | $0.162 | $9.29 | $0.040 | $0.40 | $3.95 | 2,529 |
| 25 | South Carolina | $0.162 | $9.30 | $0.040 | $0.40 | $3.96 | 2,526 |
| 26 | Oregon | $0.163 | $9.36 | $0.040 | $0.40 | $3.98 | 2,512 |
| 27 | Texas | $0.164 | $9.45 | $0.040 | $0.40 | $4.02 | 2,486 |
| 28 | Alabama | $0.168 | $9.64 | $0.041 | $0.41 | $4.10 | 2,437 |
| 29 | West Virginia | $0.168 | $9.66 | $0.041 | $0.41 | $4.11 | 2,433 |
| 30 | Minnesota | $0.170 | $9.75 | $0.041 | $0.41 | $4.15 | 2,411 |
| 31 | Virginia | $0.176 | $10.13 | $0.043 | $0.43 | $4.31 | 2,321 |
| 32 | Indiana | $0.181 | $10.44 | $0.044 | $0.44 | $4.44 | 2,252 |
| 33 | Delaware | $0.194 | $11.14 | $0.047 | $0.47 | $4.74 | 2,109 |
| 34 | Ohio | $0.195 | $11.22 | $0.048 | $0.48 | $4.78 | 2,094 |
| 35 | Wisconsin | $0.197 | $11.35 | $0.048 | $0.48 | $4.83 | 2,070 |
| 36 | Pennsylvania | $0.215 | $12.39 | $0.053 | $0.53 | $5.27 | 1,896 |
| 37 | Maryland | $0.218 | $12.52 | $0.053 | $0.53 | $5.33 | 1,877 |
| 38 | Michigan | $0.220 | $12.66 | $0.054 | $0.54 | $5.39 | 1,857 |
| 39 | New Jersey | $0.233 | $13.38 | $0.057 | $0.57 | $5.69 | 1,756 |
| 40 | Illinois | $0.238 | $13.71 | $0.058 | $0.58 | $5.84 | 1,714 |
| 41 | Vermont | $0.249 | $14.31 | $0.061 | $0.61 | $6.09 | 1,642 |
| 42 | Dist. of Columbia | $0.254 | $14.61 | $0.062 | $0.62 | $6.21 | 1,609 |
| 43 | New Hampshire | $0.273 | $15.71 | $0.067 | $0.67 | $6.69 | 1,495 |
| 44 | Connecticut | $0.274 | $15.74 | $0.067 | $0.67 | $6.70 | 1,493 |
| 45 | Alaska | $0.282 | $16.23 | $0.069 | $0.69 | $6.91 | 1,448 |
| 46 | Maine | $0.286 | $16.46 | $0.070 | $0.70 | $7.01 | 1,428 |
| 47 | Massachusetts | $0.288 | $16.57 | $0.071 | $0.71 | $7.05 | 1,418 |
| 48 | Rhode Island | $0.295 | $16.94 | $0.072 | $0.72 | $7.21 | 1,387 |
| 49 | New York | $0.299 | $17.21 | $0.073 | $0.73 | $7.32 | 1,366 |
| 50 | California | $0.333 | $19.12 | $0.081 | $0.81 | $8.14 | 1,229 |
| 51 | Hawaii | $0.520 | $29.90 | $0.127 | $1.27 | $12.72 | 786 |
The States Where EV Running Costs Have Risen the Most
Having produced a similar report in 2025, we can now compare our data from year to year and reveal the states where running costs have risen the most.
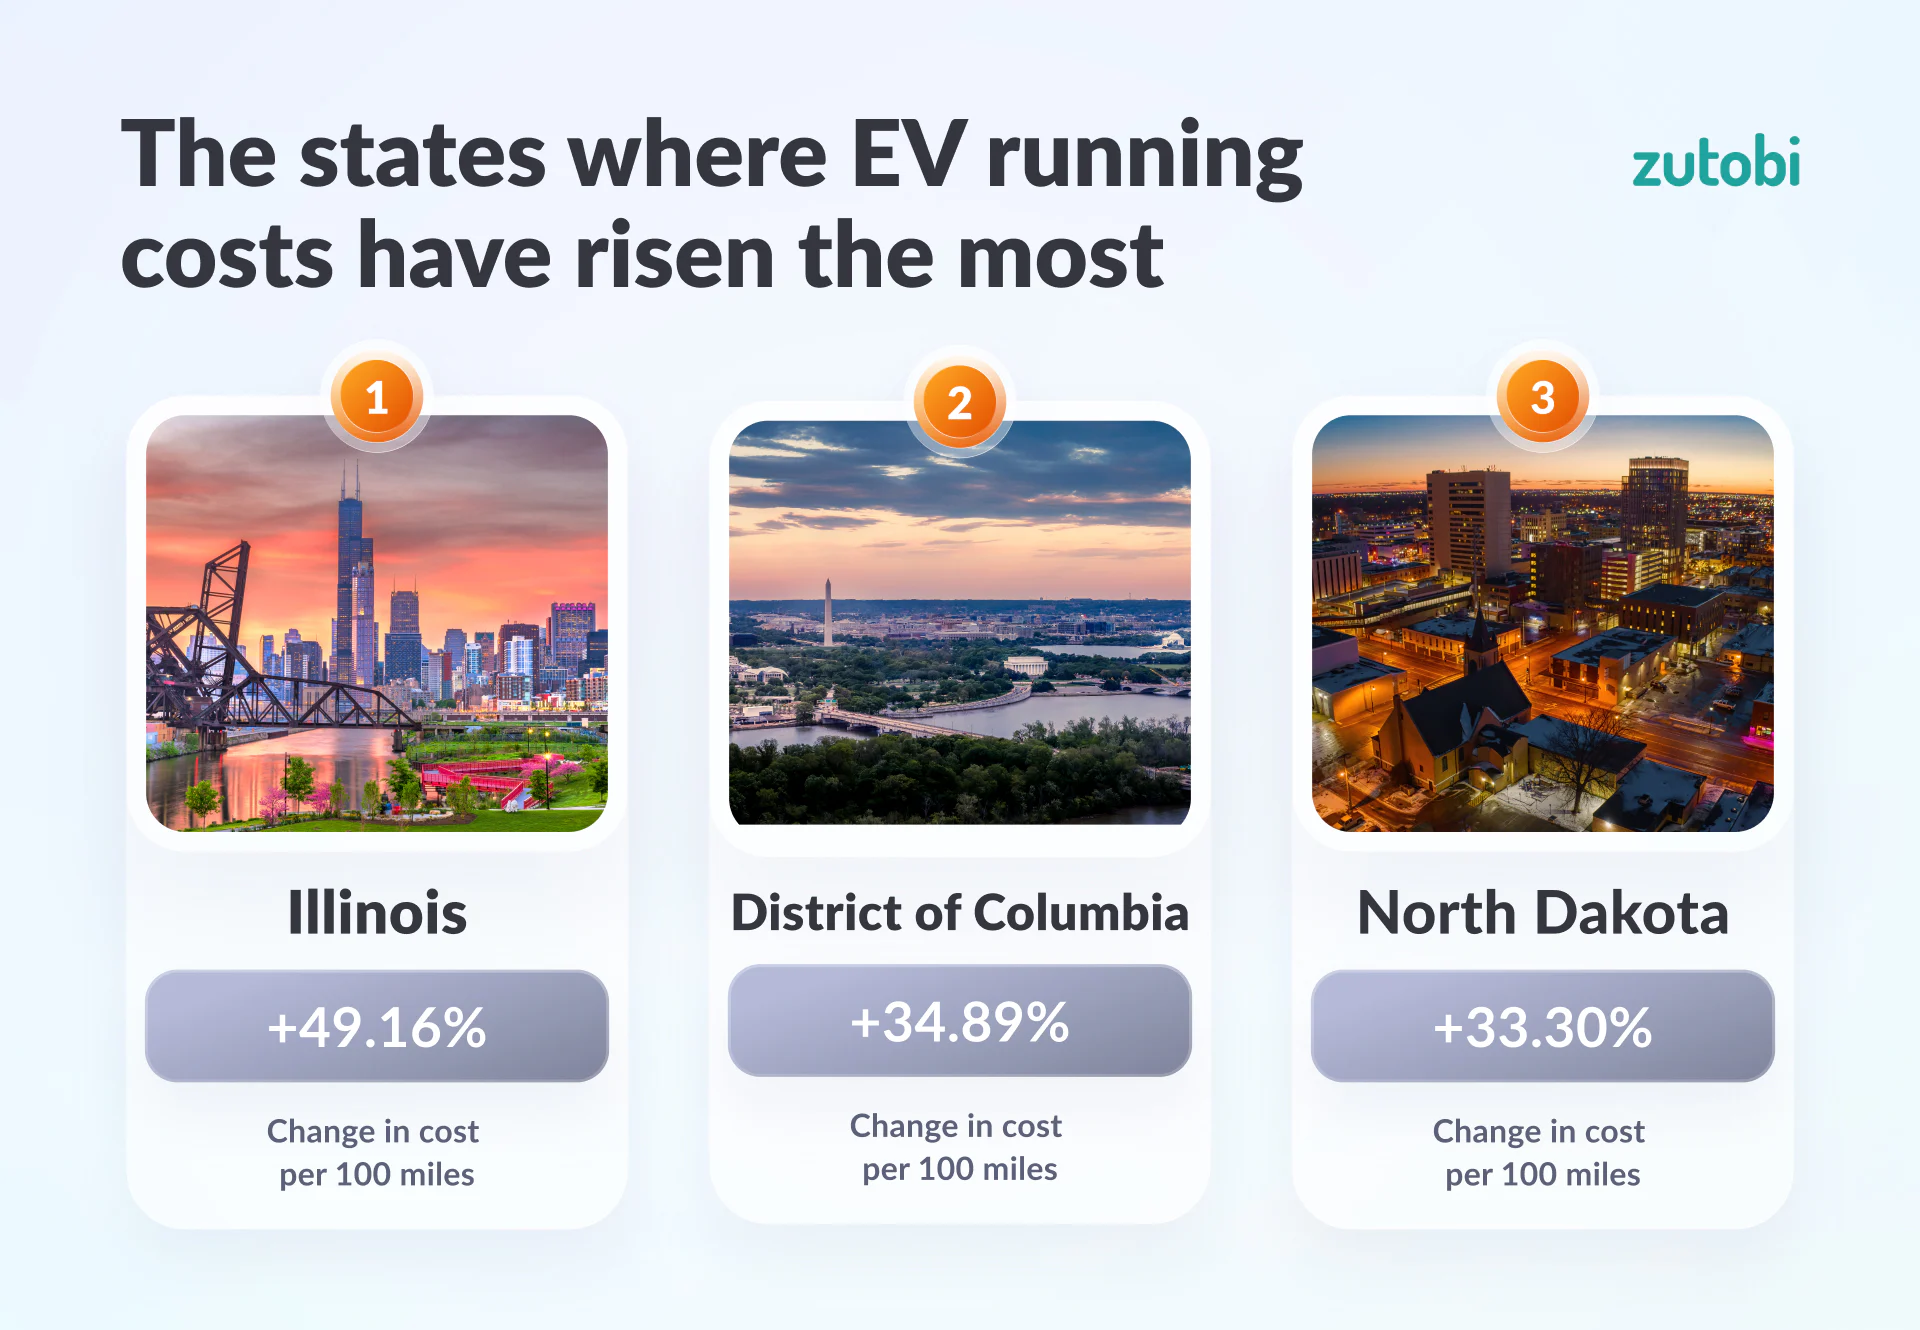
Illinois has seen the biggest increase in the cost of charging up an electric vehicle, as energy prices have risen by a whopping 49.16% since last year. This brings the cost to run a Tesla for 100 miles up to $5.84, whereas it was previously $3.91, which equates to 842 fewer miles per $100. The District of Columbia takes second place with a price increase of 34.89%, while North Dakota takes third place with an increase of 33.30%. In total, there are 44 states where the cost of electricity has risen by more than 7% in the last year, while there are several states where the cost of charging an EV actually fell.
The States Where EV Running Costs Have Decreased the Most
A smaller group of states has actually seen EV running costs fall:
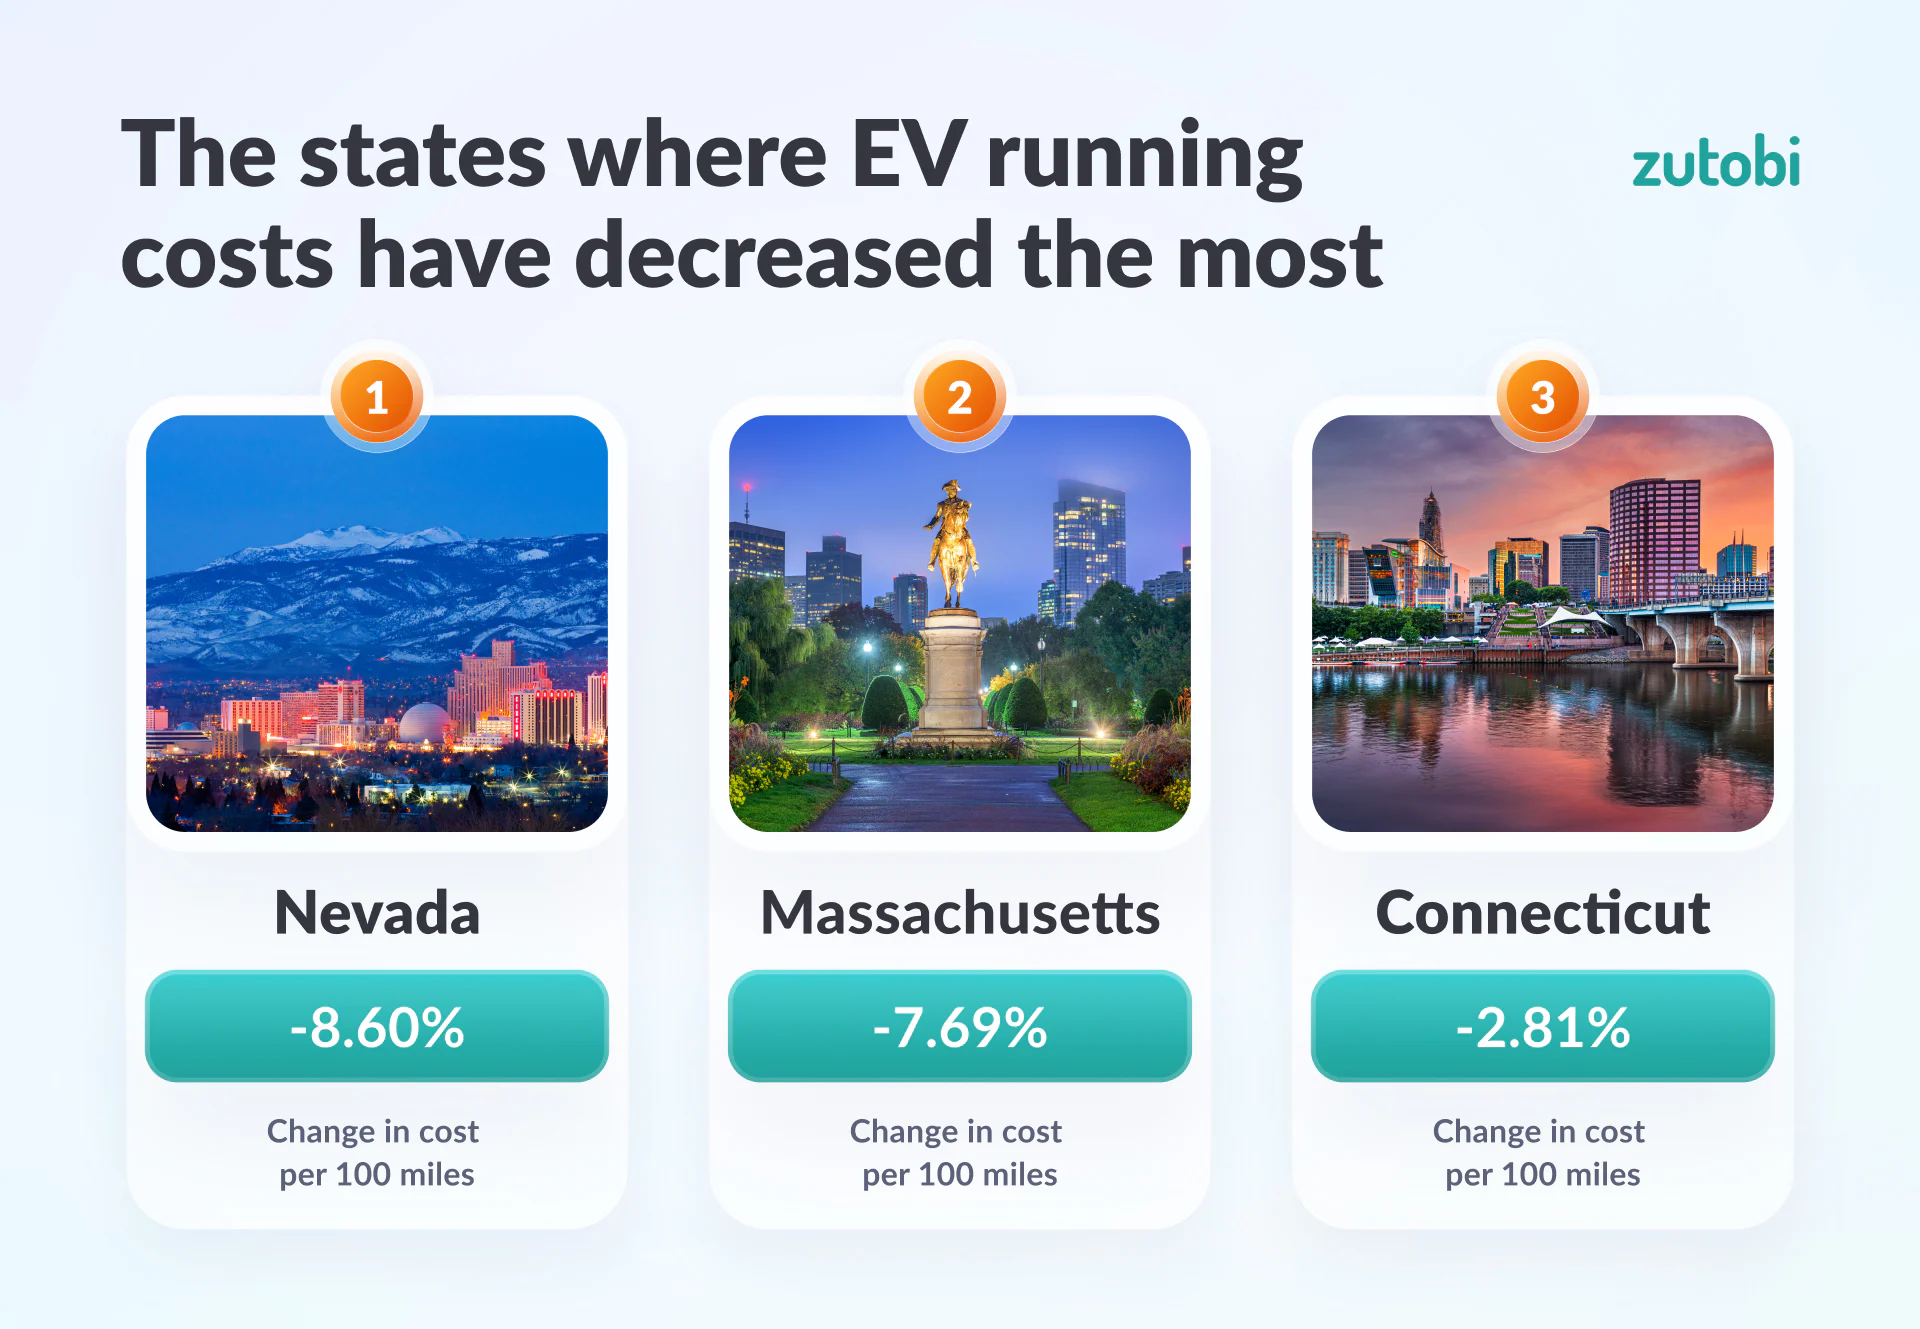
Nevada had the biggest decrease in charging costs, with an 8.60% drop in energy prices. This results in 259 more miles per $100 of charge. Massachusetts follows with a 7.69% decrease, and Connecticut rounds out the top three with a 2.81% drop in energy prices. Overall, there were 4 states with a decrease in electricity costs.
Where EV Running Costs Have Risen the Most (2024 to 2025)
| Rank | State | 2024 Cost / 100 mi | 2025 Cost / 100 mi | Change (%) | Change in Miles per $100 |
|---|---|---|---|---|---|
| 1 | Illinois | $3.91 | $5.84 | +49.2% | +842 |
| 2 | Dist. of Columbia | $4.61 | $6.21 | +34.9% | +561 |
| 3 | North Dakota | $2.50 | $3.33 | +33.3% | +1,000 |
| 4 | South Dakota | $3.04 | $3.85 | +26.7% | +692 |
| 5 | Washington | $2.89 | $3.66 | +26.4% | +721 |
| 6 | Alaska | $5.48 | $6.91 | +26.1% | +378 |
| 7 | Nebraska | $2.64 | $3.33 | +26.1% | +784 |
| 8 | Indiana | $3.53 | $4.44 | +25.9% | +582 |
| 9 | Wyoming | $2.88 | $3.62 | +25.6% | +708 |
| 10 | Montana | $2.90 | $3.59 | +23.6% | +657 |
| 11 | Hawaii | $10.36 | $12.72 | +22.8% | +179 |
| 12 | New York | $5.96 | $7.32 | +22.8% | +312 |
| 13 | Pennsylvania | $4.31 | $5.27 | +22.4% | +426 |
| 14 | Arkansas | $2.87 | $3.51 | +22.3% | +635 |
| 15 | Ohio | $3.91 | $4.78 | +22.2% | +464 |
| 16 | Virginia | $3.54 | $4.31 | +21.8% | +506 |
| 17 | Wisconsin | $3.99 | $4.83 | +21.0% | +435 |
| 18 | Louisiana | $2.86 | $3.46 | +20.9% | +605 |
| 19 | Minnesota | $3.44 | $4.15 | +20.6% | +498 |
| 20 | Mississippi | $3.29 | $3.95 | +20.2% | +512 |
| 21 | Maryland | $4.44 | $5.33 | +19.9% | +374 |
| 22 | Michigan | $4.50 | $5.39 | +19.6% | +363 |
| 23 | New Jersey | $4.77 | $5.69 | +19.4% | +341 |
| 24 | Missouri | $2.83 | $3.35 | +18.2% | +545 |
| 25 | Utah | $2.70 | $3.17 | +17.6% | +555 |
| 26 | Georgia | $3.30 | $3.88 | +17.4% | +449 |
| 27 | South Carolina | $3.39 | $3.96 | +16.7% | +421 |
| 28 | Rhode Island | $6.19 | $7.21 | +16.4% | +227 |
| 29 | Delaware | $4.08 | $4.74 | +16.2% | +341 |
| 30 | Oklahoma | $2.82 | $3.27 | +16.1% | +493 |
| 31 | West Virginia | $3.55 | $4.11 | +15.8% | +384 |
| 32 | New Hampshire | $5.78 | $6.69 | +15.7% | +235 |
| 33 | Oregon | $3.45 | $3.98 | +15.2% | +382 |
| 34 | Iowa | $3.04 | $3.46 | +13.8% | +398 |
| 35 | Kentucky | $3.25 | $3.67 | +12.8% | +349 |
| 36 | Idaho | $2.68 | $3.02 | +12.6% | +416 |
| 37 | Alabama | $3.65 | $4.10 | +12.5% | +304 |
| 38 | North Carolina | $3.30 | $3.69 | +11.9% | +321 |
| 39 | Vermont | $5.45 | $6.09 | +11.7% | +192 |
| 40 | Tennessee | $3.19 | $3.54 | +11.0% | +310 |
| 41 | Kansas | $3.39 | $3.70 | +9.2% | +250 |
| 42 | Maine | $6.43 | $7.01 | +8.9% | +127 |
| 43 | California | $7.47 | $8.14 | +8.8% | +109 |
| 44 | Texas | $3.75 | $4.02 | +7.3% | +182 |
| 45 | Florida | $3.47 | $3.71 | +6.8% | +184 |
| 46 | Colorado | $3.71 | $3.95 | +6.6% | +167 |
| 47 | Arizona | $3.72 | $3.73 | +0.2% | +5 |
| 48 | New Mexico | $3.49 | $3.45 | -1.0% | -28 |
| 49 | Connecticut | $6.89 | $6.70 | -2.8% | -42 |
| 50 | Massachusetts | $7.64 | $7.05 | -7.7% | -109 |
| 51 | Nevada | $3.64 | $3.33 | -8.6% | -259 |
Who Is Behind This Study?
This report was produced by Zutobi, a driver’s education and test-prep platform used by learner drivers across the United States. Zutobi publishes an updated EV Miles Report each year to track how the real-world cost of driving electric vehicles is changing for American drivers, alongside its core work helping new drivers prepare for permit and road tests.
Methodology
We wanted to update our EV Miles Report with the most recent data available. To do this, we used data from the same sources as before, which had been updated since our previous iteration of the study. The electricity pricing data was taken from the U.S. Energy Information Administration, while the data for real-world range and usable battery capacity was taken from Electric Vehicle Database. We also increased the number of vehicles and states covered to give a more comprehensive view of the current EV landscape.
The Previous EV Miles Reports
If you want to read our previous report you can download it here:

Take our full course with tests and theory
600+ exam-like questions and practice tests
Easy summarized DMV handbook
America’s #1 driver’s ed app with a 95.8% pass rate
Recommended articles



Ace your DMV test, guaranteed
Want to Be the Top School in Your Area?

- Simple & automated admin
- More time for teaching
- #1 learning materials for students
Start learning now
Resources
- Driver’s License Renewal
- How to Get Your US Driver’s License
- How to Prepare for Your Road Test
- How to Get a Driver’s Permit
- Behind-The-Wheel training
- Courses
- Blog
- FAQ
Show More


©2026 Zutobi AB, 4 Peddlers Row, Unit #103, Newark, DE 19702