loved by
15.1+ million
users
The 2026 EV Charging Station Report: State-by-State Breakdown
America is at an electric crossroads. Gas prices remain elevated, national averages have repeatedly tested the $4 per gallon threshold, and millions of drivers are actively weighing the economics of switching to an electric vehicle. Yet the infrastructure that would make that switch seamless is struggling to keep pace with surging demand.To assess the current state of EV infrastructure, we present the updated 2026 U.S. Electric Vehicle Charging Station Report, offering a comprehensive state-by-state breakdown.
In this report, we explore key questions: How does the rapid growth in EV adoption compare to the development of charging infrastructure? By analyzing the latest data, we aim to provide insights into the feasibility of building a robust EV charging network while evaluating the current EV adoption rates compared to conventional vehicles. Additionally, we examine the major changes since the previous edition, shedding light on the evolving landscape of EVs and charging stations across the U.S.
- The number of EVs in the U.S. has increased by 26.7%, growing from 3.56 million to over 4.5 million.
- For the first time, charging infrastructure has kept pace, rising by 34.6%, from 180,000 to over 242,000 public ports.
States with the most charging stations per EVs
When you’re considering switching to an electric vehicle you need to consider the competition for charging points. It’s all well and good to go green and try and cut your emissions, but if you can’t charge your vehicle, you aren’t going to get very far. Here are the states with the most chargers per 100 electric vehicles.
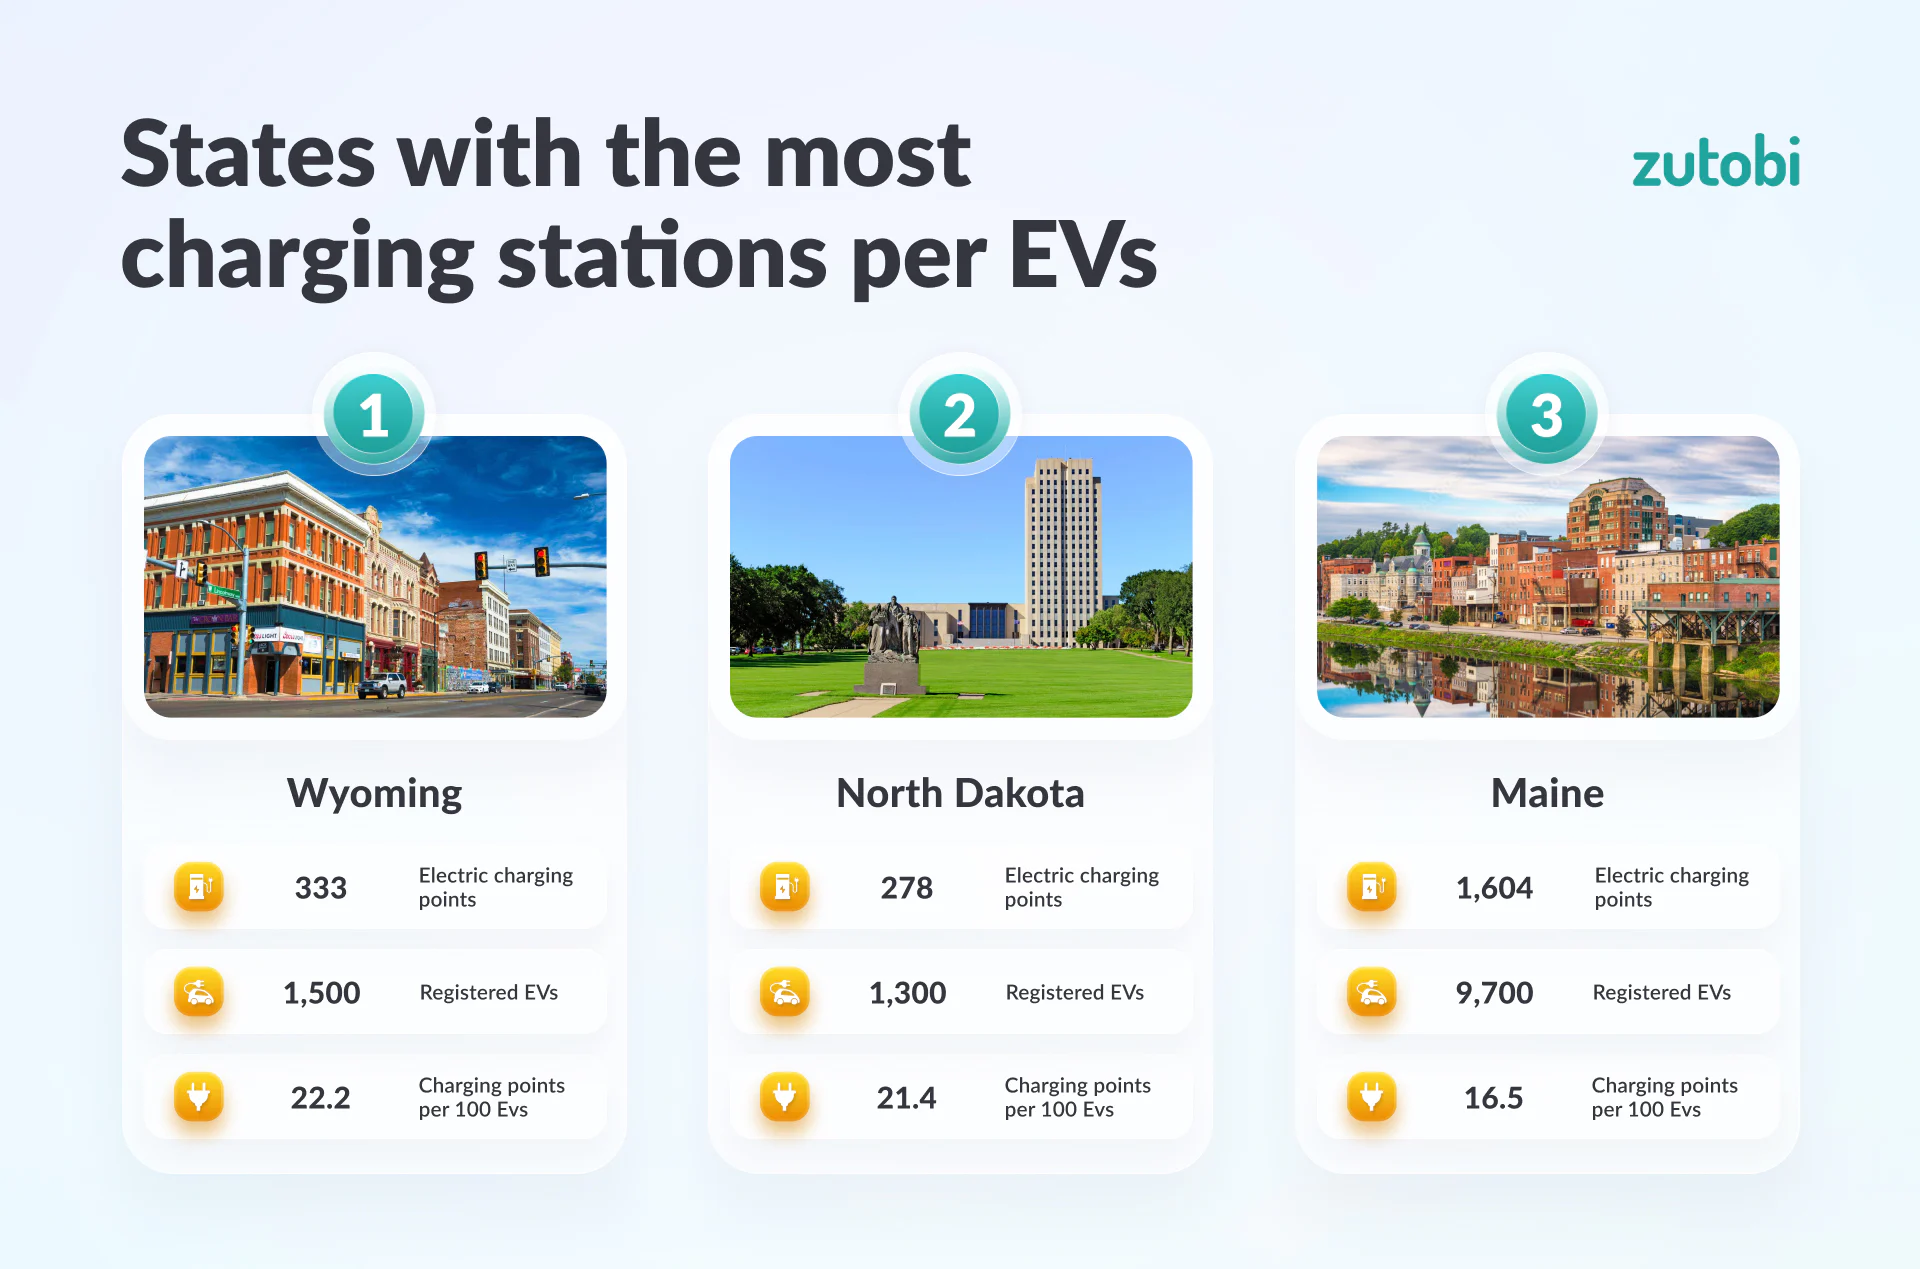
Place 1 – Wyoming
Total electric charging ports: 333
Registered EVs: 1,500
Charging stations per 100 EVs: 22.2
Wyoming leads the nation in terms of charging stations per EV, with 22.2 chargers for every 100 electric vehicles. Despite having only 1,500 registered EVs, Wyoming boasts 333 charging points across the state. This impressive ratio is a reflection of state policies encouraging EV adoption by focusing on infrastructure development first. Wyoming has received federal funds to ensure that charging stations are placed strategically along major highways, ensuring that even in rural areas, EV drivers have access to charging options. However, the low EV adoption rate suggests that more efforts are needed to attract residents to switch to electric.
Place 2 – North Dakota
Total electric charging ports: 278
Registered EVs: 1,300
Charging stations per 100 EVs: 21.4
North Dakota has also prioritized infrastructure over adoption, offering 21.4 charging stations per 100 EVs, despite having only 1,300 registered electric vehicles. The state operates 278 charging stations, which serve its small but growing population of EV owners. Like Wyoming, North Dakota’s low number of EVs means that current drivers enjoy easy access to chargers. However, as adoption grows, the state will need to continue expanding its charging network to maintain this favorable ratio.
Place 3 – Maine
Total electric charging ports: 1,604
Registered EVs: 9,700
Charging stations per 100 EVs: 16.5
Maine enters the top three for the first time, with 16.5 charging points per 100 EVs, thanks to a 47.97% surge in public charging infrastructure over the past year, one of the biggest expansions in the nation. The state’s 1,604 chargers serve 9,700 registered electric vehicles across a largely rural landscape. Maine’s investment in charging stations reflects its commitment to preparing for future EV growth, including the needs of out-of-state visitors traveling along its scenic coastal and inland corridors.
States with the fewest charging stations per EVs
Nevertheless, several states are facing challenges in keeping pace with the rapidly growing demand for electric vehicles, particularly in terms of charging infrastructure.
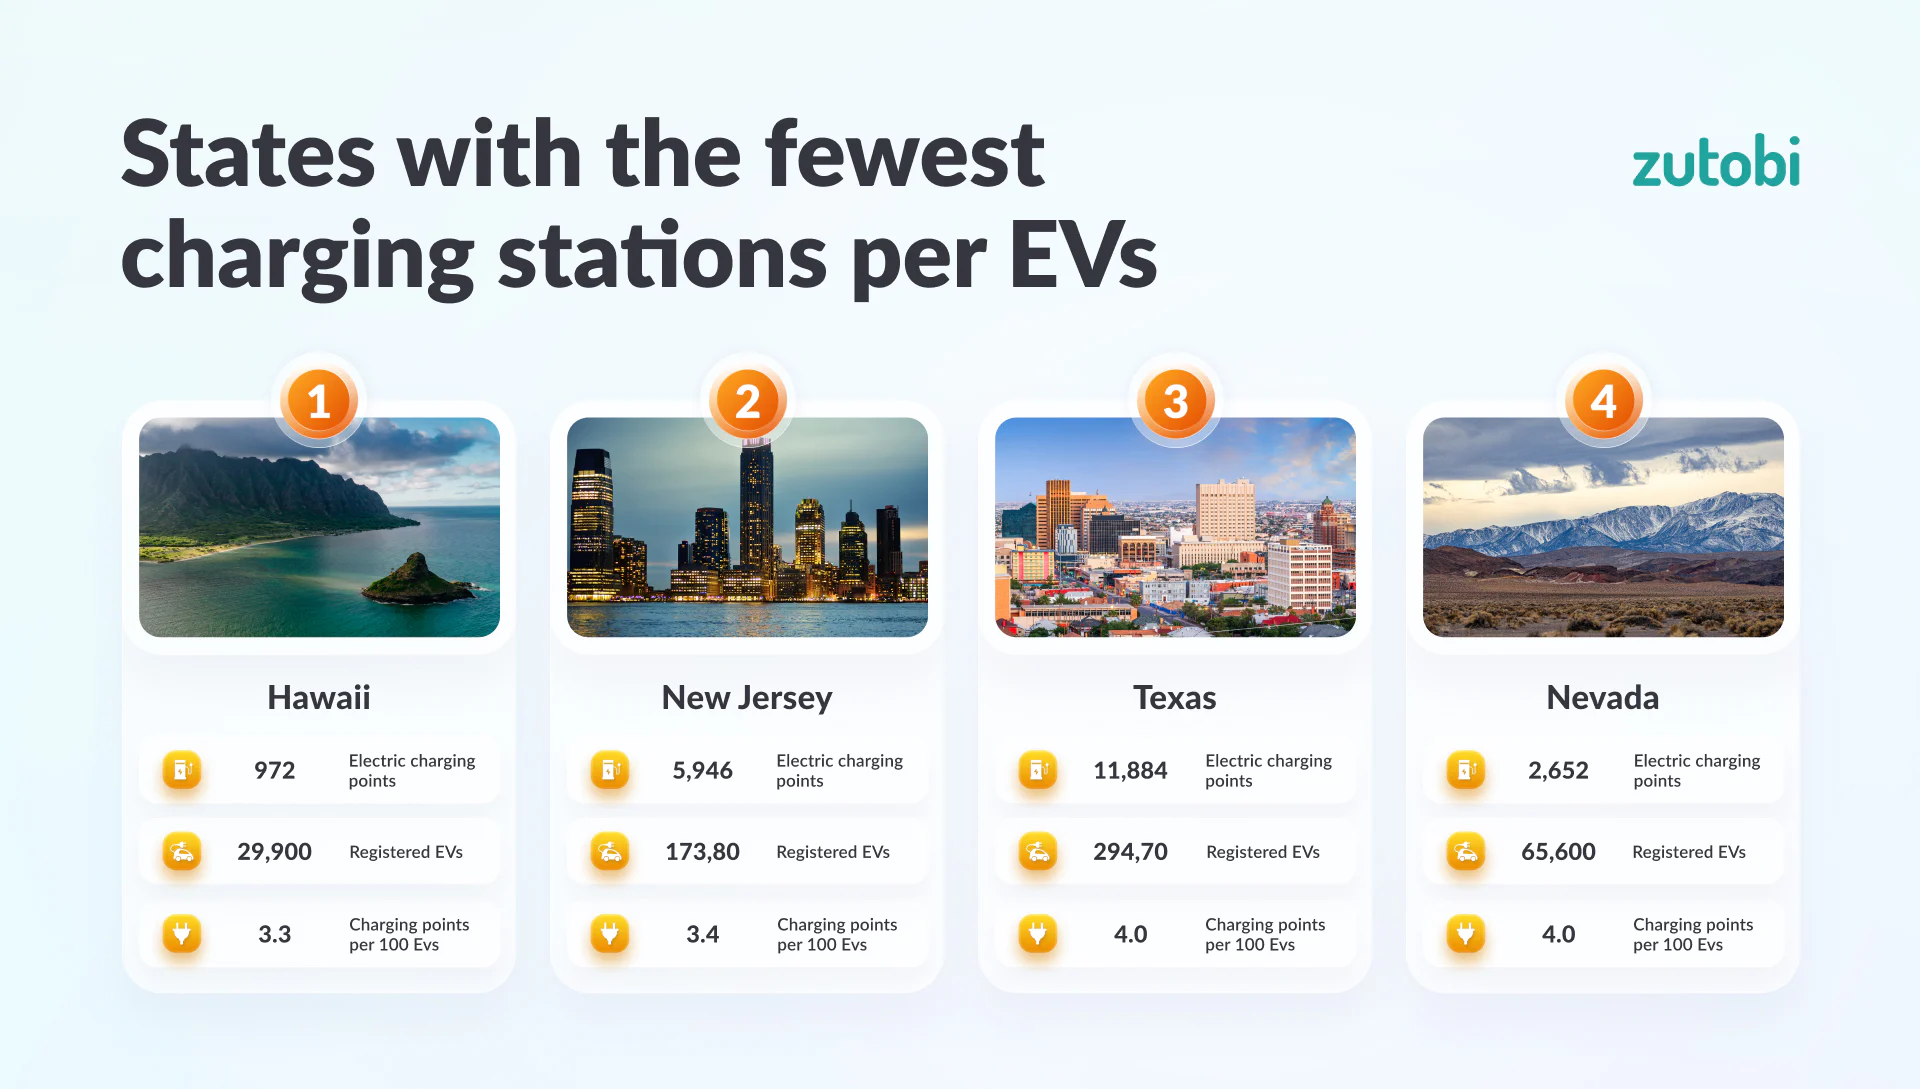
Place 1 – Hawaii
Total electric charging points: 972
Registered EVs: 29,900
Charging stations per 100 EVs: 3.3
Hawaii has the fewest charging points per EV in the nation, with just 3.3 chargers for every 100 electric vehicles. The state has 972 charging points for its 29,900 registered EVs. While Hawaii has seen steady growth in EV ownership, driven by its aggressive clean energy policies and relatively short driving distances, its isolated island geography and limited land area make expanding charging infrastructure a significant challenge. Notably, the state’s charging network actually declined between the 2023 and 2024 reports before recovering in 2025, underscoring how fragile progress can be without sustained investment. The state government continues to push for clean energy solutions, with policies in place to promote the installation of more chargers to meet future demand.
Place 2 – New Jersey
Total electric charging points: 5,946
Registered EVs: 173,800
Charging stations per 100 EVs: 3.4
New Jersey has made remarkable progress in expanding its EV infrastructure, but it still lags behind in terms of charging stations per EV, with only 3.4 chargers for every 100 electric vehicles. The state boasts a high number of registered EVs, with 173,800 on the road, but only 5,946 charging stations are available to serve them. Charging infrastructure grew by 59.71% compared to the previous year, one of the highest rates in the nation, yet the state’s runaway EV adoption continues to outpace supply. More effort is needed to keep up with demand, particularly in its densely populated northern counties.
Place 3 – Texas
Total electric charging points: 11,884
Registered EVs: 294,700
Charging stations per 100 EVs: 4.0
Texas has entered the bottom tier for the first time, with 4.0 charging stations per 100 EVs. The state’s enormous EV fleet of 294,700 vehicles, the second largest in the nation, has outgrown its charging network despite a 37.59% increase in charging infrastructure over the past year. Texas’s vast geography compounds the challenge: distances between cities are long, placing particular pressure on fast-charging corridors. Although Texas has experienced significant growth in both EVs and charging stations, more investment will be needed to ensure that drivers across the state have reliable access to charging options.
How many EV charging stations are there in the US? State-by-state breakdown
| № | States | Electric charging points | Registered EVs | Charging points per 100 EVs |
|---|---|---|---|---|
| 1 | Wyoming | 333 | 1,500 | 22.2 |
| 2 | North Dakota | 278 | 1,300 | 21.4 |
| 3 | Maine | 1,604 | 9,700 | 16.5 |
| 4 | South Dakota | 345 | 2,300 | 15.0 |
| 5 | West Virginia | 554 | 3,800 | 14.6 |
| 6 | Mississippi | 667 | 4,900 | 13.6 |
| 7 | Vermont | 1,388 | 10,200 | 13.6 |
| 8 | Connecticut | 4,676 | 39,400 | 11.9 |
| 9 | Massachusetts | 10,648 | 91,100 | 11.7 |
| 10 | Arkansas | 1,083 | 9,500 | 11.4 |
| 11 | New York | 19,125 | 168,100 | 11.4 |
| 12 | Dist. of Columbia | 1,129 | 10,100 | 11.2 |
| 13 | Iowa | 1,283 | 11,700 | 11.0 |
| 14 | Rhode Island | 841 | 8,300 | 10.1 |
| 15 | Alabama | 1,684 | 17,500 | 9.6 |
| 16 | Missouri | 3,180 | 34,200 | 9.3 |
| 17 | Kansas | 1,338 | 14,500 | 9.2 |
| 18 | New Mexico | 1,154 | 13,000 | 8.9 |
| 19 | Montana | 475 | 5,600 | 8.5 |
| 20 | Nebraska | 706 | 9,100 | 7.8 |
| 21 | South Carolina | 2,034 | 26,800 | 7.6 |
| 22 | Ohio | 5,201 | 69,400 | 7.5 |
| 23 | Louisiana | 860 | 11,600 | 7.4 |
| 24 | Kentucky | 1,108 | 15,000 | 7.4 |
| 25 | Tennessee | 3,011 | 42,600 | 7.1 |
| 26 | Michigan | 5,349 | 75,800 | 7.1 |
| 27 | Oklahoma | 1,617 | 22,600 | 7.2 |
| 28 | Minnesota | 3,069 | 47,400 | 6.5 |
| 29 | Wisconsin | 2,196 | 32,300 | 6.8 |
| 30 | Delaware | 712 | 11,100 | 6.4 |
| 31 | North Carolina | 5,681 | 91,000 | 6.2 |
| 32 | Pennsylvania | 5,588 | 89,900 | 6.2 |
| 33 | Alaska | 211 | 3,400 | 6.2 |
| 34 | New Hampshire | 779 | 12,700 | 6.1 |
| 35 | Georgia | 7,288 | 120,000 | 6.1 |
| 36 | Idaho | 664 | 11,000 | 6.0 |
| 37 | Indiana | 2,067 | 34,600 | 6.0 |
| 38 | Colorado | 7,183 | 127,000 | 5.7 |
| 39 | Maryland | 5,416 | 94,900 | 5.7 |
| 40 | Utah | 2,939 | 52,200 | 5.6 |
| 41 | Oregon | 4,189 | 78,400 | 5.3 |
| 42 | Virginia | 5,351 | 107,400 | 5.0 |
| 43 | Illinois | 5,443 | 125,500 | 4.3 |
| 44 | Florida | 14,218 | 334,800 | 4.2 |
| 45 | Washington | 8,053 | 191,400 | 4.2 |
| 46 | Arizona | 4,556 | 111,200 | 4.1 |
| 47 | California | 63,320 | 1,533,900 | 4.1 |
| 48 | Nevada | 2,652 | 65,600 | 4.0 |
| 49 | Texas | 11,884 | 294,700 | 4.0 |
| 50 | New Jersey | 5,946 | 173,800 | 3.4 |
| 51 | Hawaii | 972 | 29,900 | 3.3 |
The US states with the highest percentage of electric vehicles on the road
While infrastructure plays a crucial role, it is equally important to emphasize that numerous states are experiencing a significant uptake in electric vehicles when compared to the overall number of vehicles on the road.
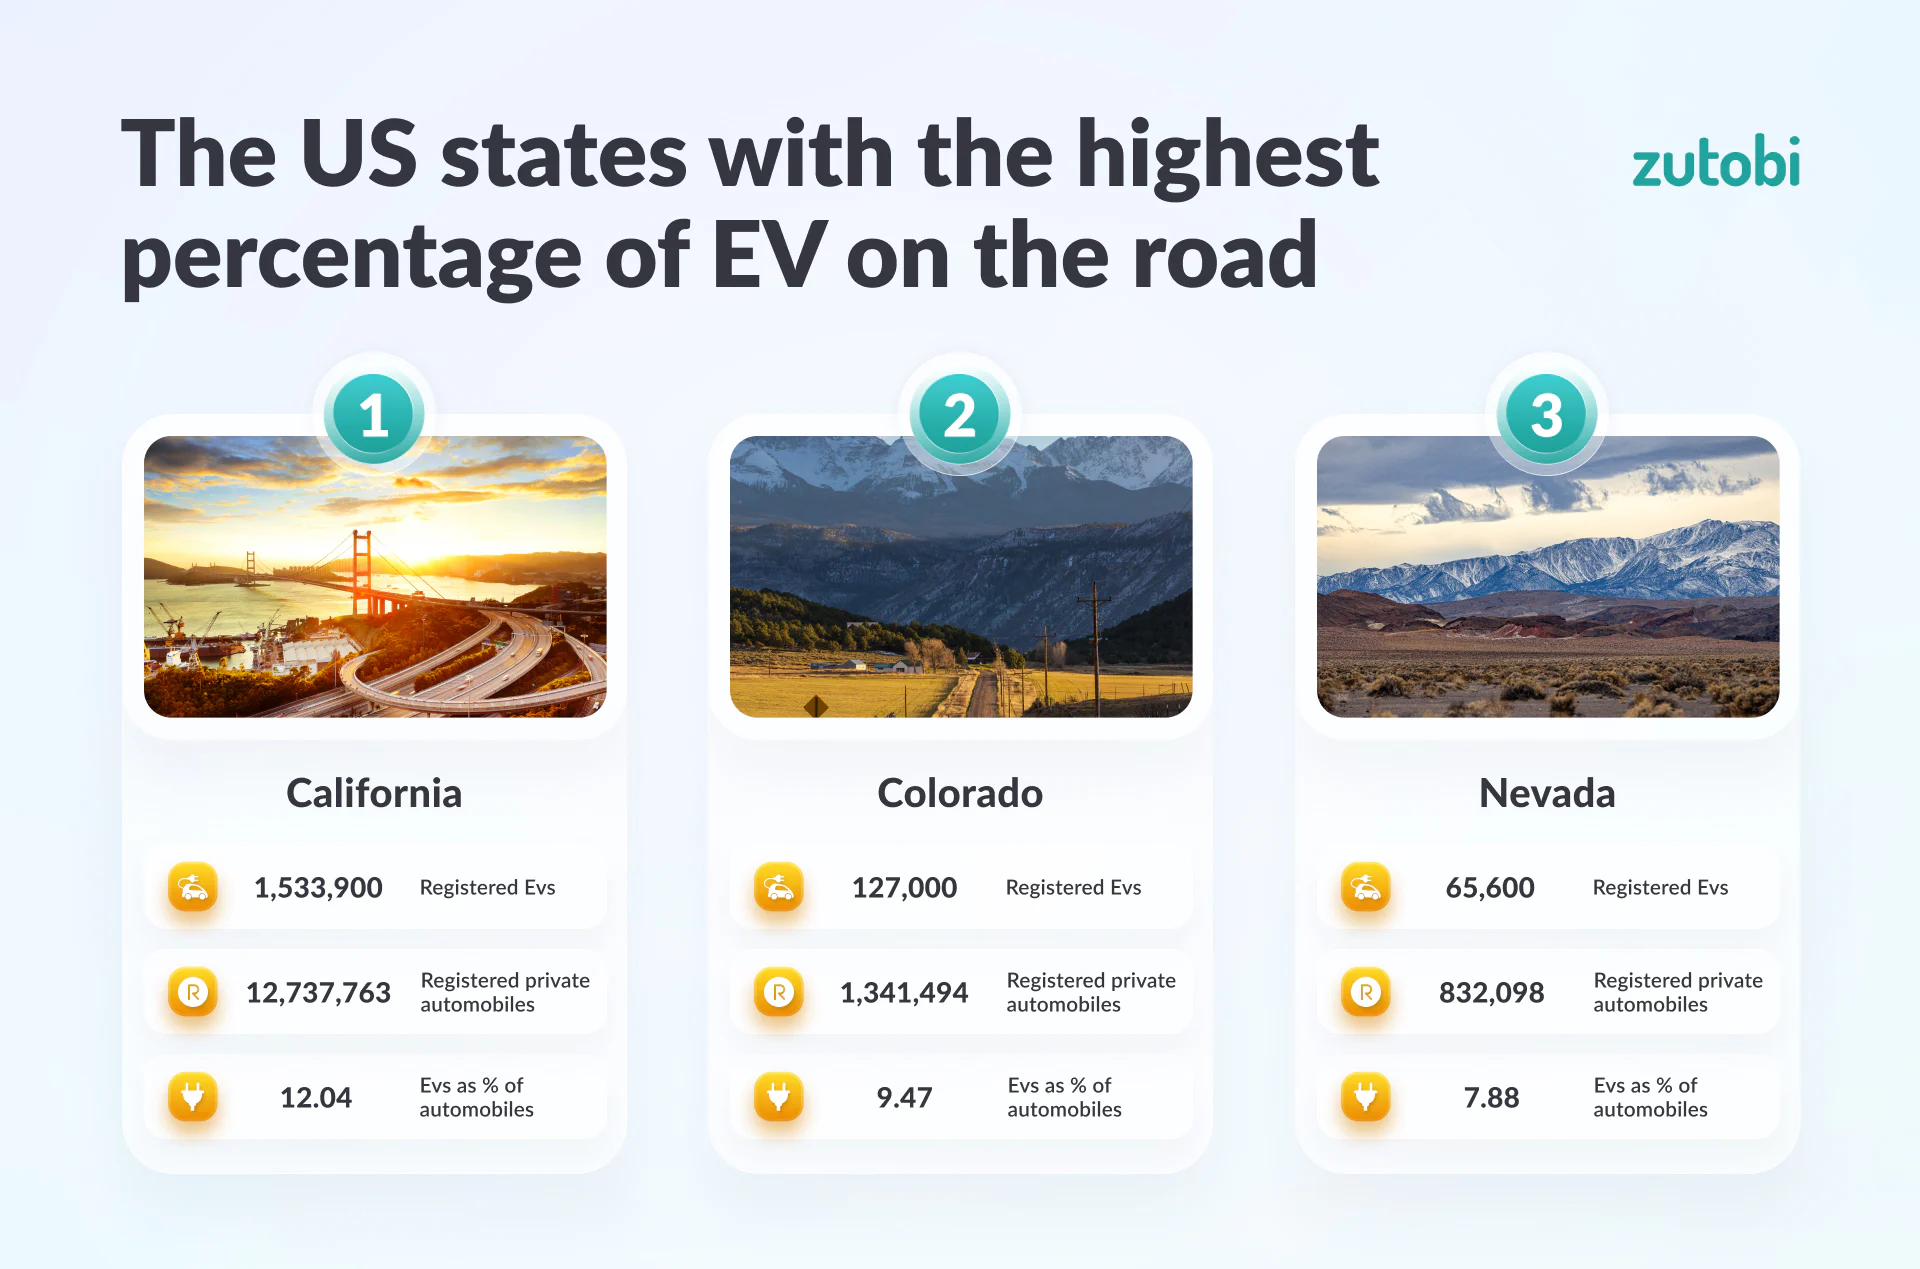
Place 1 – California
Registered EVs: 1,533,900
Registered private automobiles: 12,737,763
EVs as a percentage of total automobiles: 12.04%
California remains the leader in EV adoption in the U.S., with 12.04% of its private vehicles now electric. This impressive figure is driven by the state’s zero-emission vehicle mandate and strong environmental policies that have incentivized both individuals and businesses to transition to electric vehicles. The Advanced Clean Cars II regulation, which mandates all new cars sold by 2035 to be zero-emission, has further propelled California’s dominance in the EV market. With more than 1.5 million EVs on its roads, California alone accounts for roughly one in three electric vehicles registered nationwide.
Place 2 – Colorado
Registered EVs: 127,000
Registered private automobiles: 1,341,494
EVs as a percentage of total automobiles: 9.47%
Colorado has surged to second place, with nearly 9.5% of its vehicles now electric, up from 6.31% in the previous report. The state’s focus on environmental sustainability, paired with attractive tax incentives for EV buyers stacked on top of federal credits, has helped to grow the EV market significantly. Continued investments in charging infrastructure, including rural areas, have positioned Colorado as a leader in the transition to electric mobility.
Place 3 – Nevada
Registered EVs: 65,600
Registered private automobiles: 832,098
EVs as a percentage of total automobiles: 7.88%
Nevada enters the top three for the first time, with 7.88% of its vehicles now electric. The state’s growing tech economy, a thriving EV rideshare and taxi fleet in Las Vegas, and its position along major interstate corridors that have attracted significant federal NEVI charging investment have all contributed to Nevada’s rapid rise. Government-backed programs and utility incentives have supported this transition and helped make EV ownership increasingly practical for Nevada residents.
The US states with the lowest proportion of electric vehicles on the road
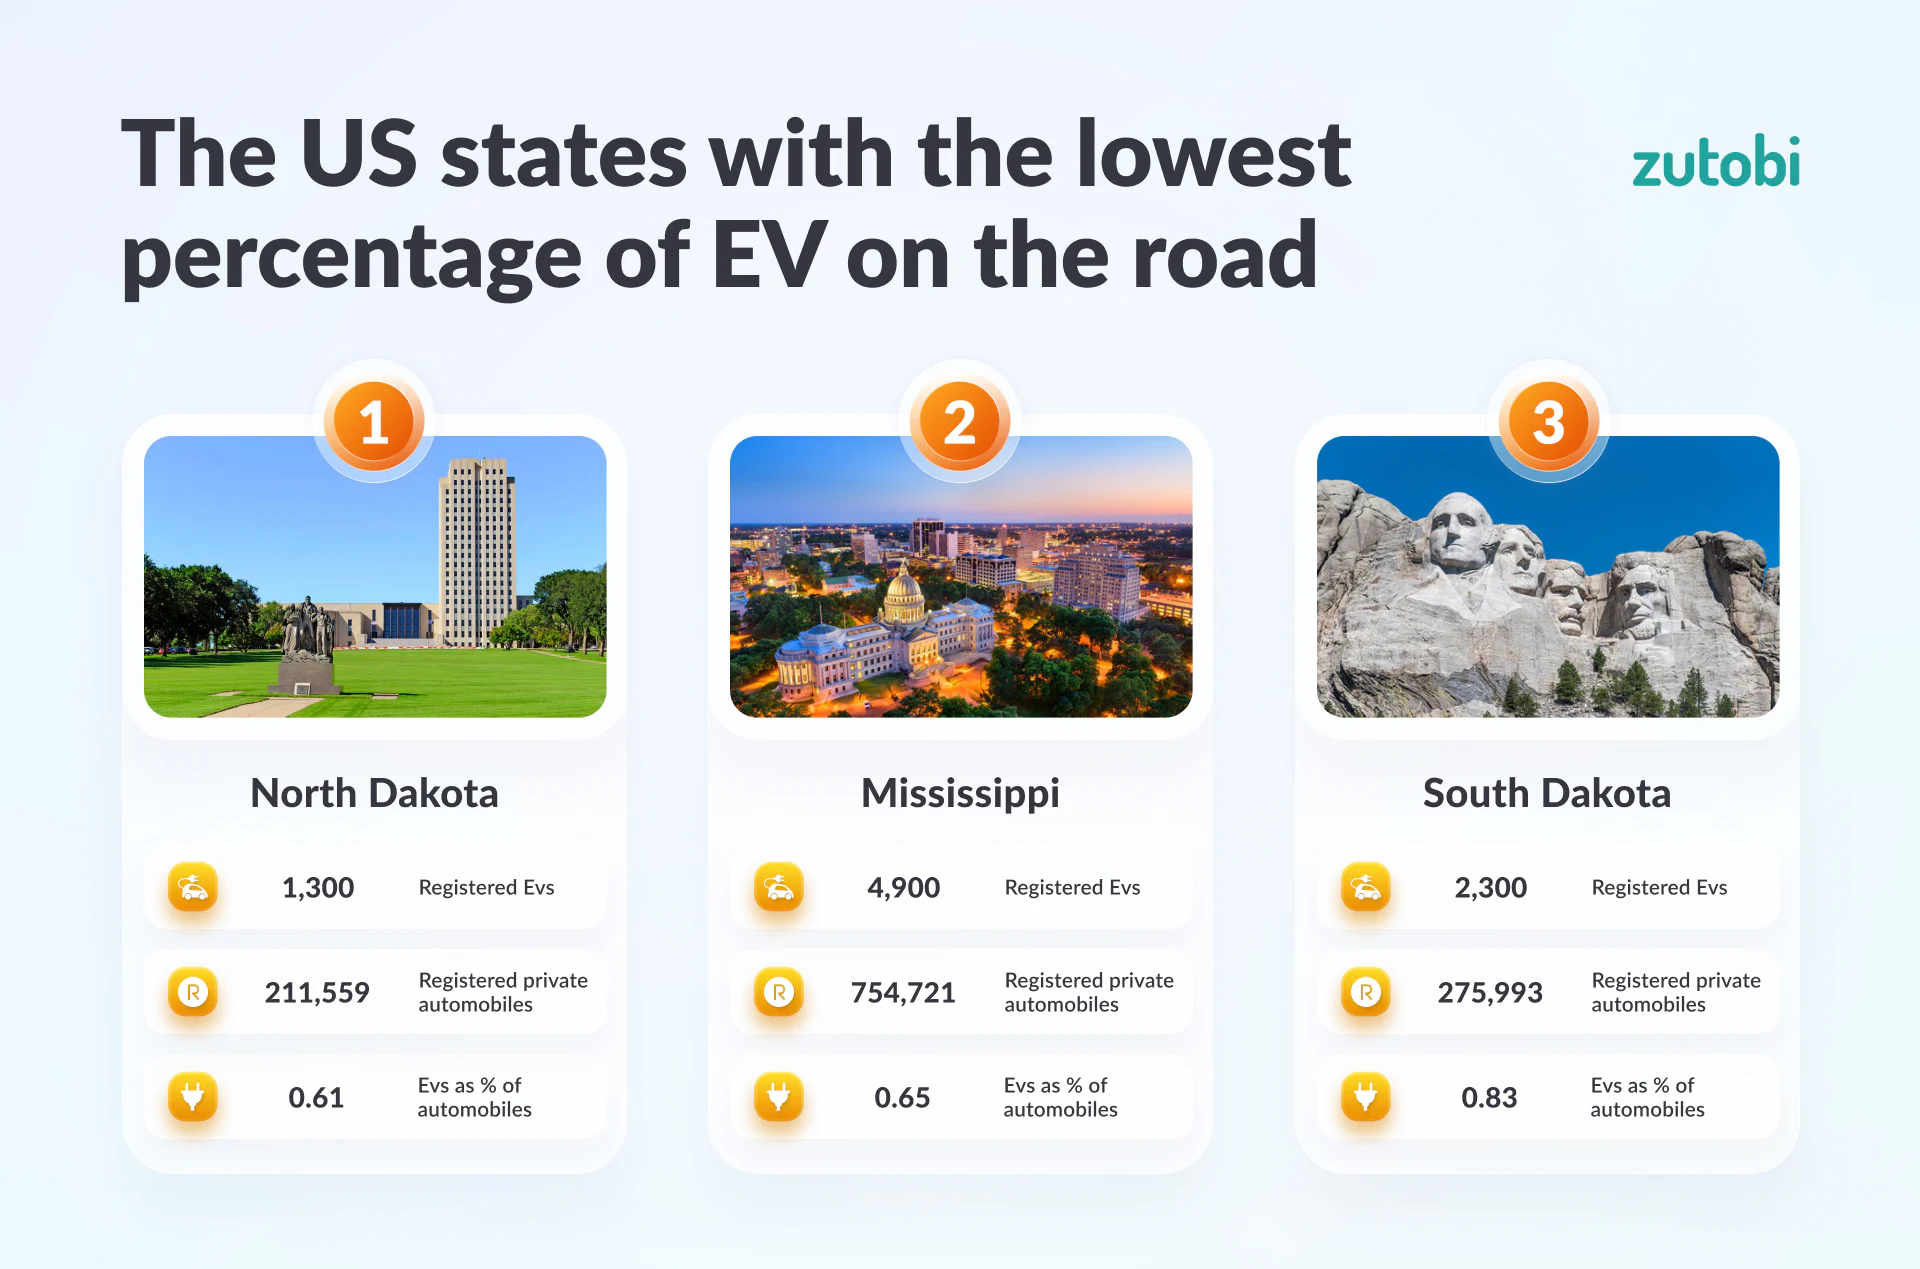
Place 1 – North Dakota
Registered EVs: 1,300
Registered private automobiles: 211,559
EVs as a percentage of total automobiles: 0.61%
North Dakota faces the most significant challenges in EV adoption, with only 0.61% of vehicles on the road being electric. The state’s vast rural areas and colder climate, which can negatively impact battery performance, contribute to this slow growth. While North Dakota does have a strong ratio of charging stations per EV, there is still a need for more robust policies to increase EV adoption and translate infrastructure investment into real-world demand.
Place 2 – Mississippi
Registered EVs: 4,900
Registered private automobiles: 754,721
EVs as a percentage of total automobiles: 0.65%
Mississippi has one of the lowest proportions of electric vehicles in the U.S., with just 0.65% of its vehicles being electric. The state’s rural landscape, combined with lower median incomes that limit the practical value of purchase incentives, has hampered the growth of the EV market. Without significant investments in both infrastructure and targeted incentive programs, Mississippi is likely to continue trailing behind other states in the transition to electric vehicles, even as EV registrations grew by a notable 36.5% in the past year.
Place 3 – South Dakota
Registered EVs: 2,300
Registered private automobiles: 275,993
EVs as a percentage of total automobiles: 0.83%
South Dakota has a low percentage of electric vehicles, with just 0.83% of private automobiles being electric. The state’s vast rural expanse and historically limited EV charging infrastructure pose significant hurdles to widespread EV adoption. Although there have been meaningful investments in charging stations, South Dakota recorded a 48.71% increase in charging ports this year, more support and consumer education are needed to encourage greater EV usage in the state.
The US states with the highest percentage of electric vehicles on the road
| № | State | Registered EVs | Registered private automobiles | EVs as % of automobiles |
|---|---|---|---|---|
| 1 | California | 1,533,900 | 12,737,763 | 12.04 |
| 2 | Colorado | 127,000 | 1,341,494 | 9.47 |
| 3 | Nevada | 65,600 | 832,098 | 7.88 |
| 4 | Washington | 191,400 | 2,476,547 | 7.73 |
| 5 | New Jersey | 173,800 | 2,251,730 | 7.72 |
| 6 | Delaware | 11,100 | 146,701 | 7.57 |
| 7 | Dist. of Columbia | 10,100 | 138,559 | 7.29 |
| 8 | Hawaii | 29,900 | 415,330 | 7.20 |
| 9 | Vermont | 10,200 | 162,650 | 6.27 |
| 10 | Oregon | 78,400 | 1,291,044 | 6.07 |
| 11 | Utah | 52,200 | 952,444 | 5.48 |
| 12 | Massachusetts | 91,100 | 1,690,199 | 5.39 |
| 13 | Maryland | 94,900 | 1,882,459 | 5.04 |
| 14 | Arizona | 111,200 | 2,254,643 | 4.93 |
| 15 | Florida | 334,800 | 7,113,843 | 4.71 |
| 16 | Virginia | 107,400 | 2,794,568 | 3.84 |
| 17 | Connecticut | 39,400 | 1,028,325 | 3.83 |
| 18 | Georgia | 120,000 | 3,154,970 | 3.80 |
| 19 | Illinois | 125,500 | 3,443,638 | 3.64 |
| 20 | Texas | 294,700 | 7,184,055 | 4.10 |
| 21 | North Carolina | 91,000 | 2,963,141 | 3.07 |
| 22 | Michigan | 75,800 | 2,493,266 | 3.04 |
| 23 | New Hampshire | 12,700 | 387,846 | 3.27 |
| 24 | Maine | 9,700 | 305,020 | 3.18 |
| 25 | New York | 168,100 | 6,452,828 | 2.61 |
| 26 | Alaska | 3,400 | 120,421 | 2.82 |
| 27 | Rhode Island | 8,300 | 304,190 | 2.73 |
| 28 | Pennsylvania | 89,900 | 3,331,835 | 2.70 |
| 29 | Minnesota | 47,400 | 1,592,071 | 2.98 |
| 30 | Kansas | 14,500 | 592,793 | 2.45 |
| 31 | Idaho | 11,000 | 504,204 | 2.18 |
| 32 | New Mexico | 13,000 | 571,192 | 2.28 |
| 33 | Oklahoma | 22,600 | 1,055,607 | 2.14 |
| 34 | Missouri | 34,200 | 1,644,583 | 2.08 |
| 35 | Wisconsin | 32,300 | 1,594,530 | 2.03 |
| 36 | Indiana | 34,600 | 1,752,726 | 1.97 |
| 37 | Tennessee | 42,600 | 2,211,560 | 1.93 |
| 38 | Ohio | 69,400 | 3,767,531 | 1.84 |
| 39 | Nebraska | 9,100 | 551,466 | 1.65 |
| 40 | South Carolina | 26,800 | 1,659,552 | 1.61 |
| 41 | Iowa | 11,700 | 998,101 | 1.17 |
| 42 | Montana | 5,600 | 524,624 | 1.07 |
| 43 | Arkansas | 9,500 | 892,704 | 1.06 |
| 44 | Kentucky | 15,000 | 1,431,848 | 1.05 |
| 45 | Wyoming | 1,500 | 157,686 | 0.95 |
| 46 | West Virginia | 3,800 | 391,085 | 0.97 |
| 47 | Alabama | 17,500 | 1,932,886 | 0.91 |
| 48 | Louisiana | 11,600 | 1,337,616 | 0.87 |
| 49 | South Dakota | 2,300 | 275,993 | 0.83 |
| 50 | Mississippi | 4,900 | 754,721 | 0.65 |
| 51 | North Dakota | 1,300 | 211,559 | 0.61 |
How have the number of EVs and charging stations in the US changed?
The growth in electric vehicle (EV) adoption across the U.S. has continued at a strong pace over the past year. In 2024, there were just over 3.56 million registered EVs, but by 2025, that number grew to more than 4.5 million, representing a 26.7% increase in electric vehicle registrations nationwide. States like Michigan, Louisiana, and Colorado have seen the most significant growth, with increases of over 40%, driven by a combination of state-level incentives, expanding charging infrastructure, and growing consumer demand for cleaner and cheaper-to-run transportation options as gas prices remain elevated.
While EV registrations have continued to surge, the expansion of charging infrastructure has also accelerated and for the first time, outpaced EV growth. In 2024, there were around 180,000 public charging stations, and this number increased to over 242,000 in 2025, representing a 34.6% growth in the total number of charging ports. States like Connecticut and New York led the nation in this area, with increases of over 70% in their charging infrastructure.
This represents an important turning point: the national ratio of chargers to EVs is improving for the first time in several years. However, as EV adoption continues to grow rapidly, ensuring that charging infrastructure sustains this pace will be critical. While states like Michigan and Connecticut have made significant investments in charging networks, many rural and less populated areas still lag behind, presenting challenges for EV drivers in those regions.
To support this growth, federal and state programs have been implemented, such as the federal government’s goal to have 50% of new car sales be electric by 2030, and infrastructure bills that provide funding for EV charging stations nationwide. The NEVI Formula Program in particular is channeling dedicated funds toward fast-charging stations along Interstate highway corridors. These initiatives are crucial to addressing range anxiety and making electric vehicles a viable option for all drivers, regardless of location.
States with the biggest increase in registered EVs
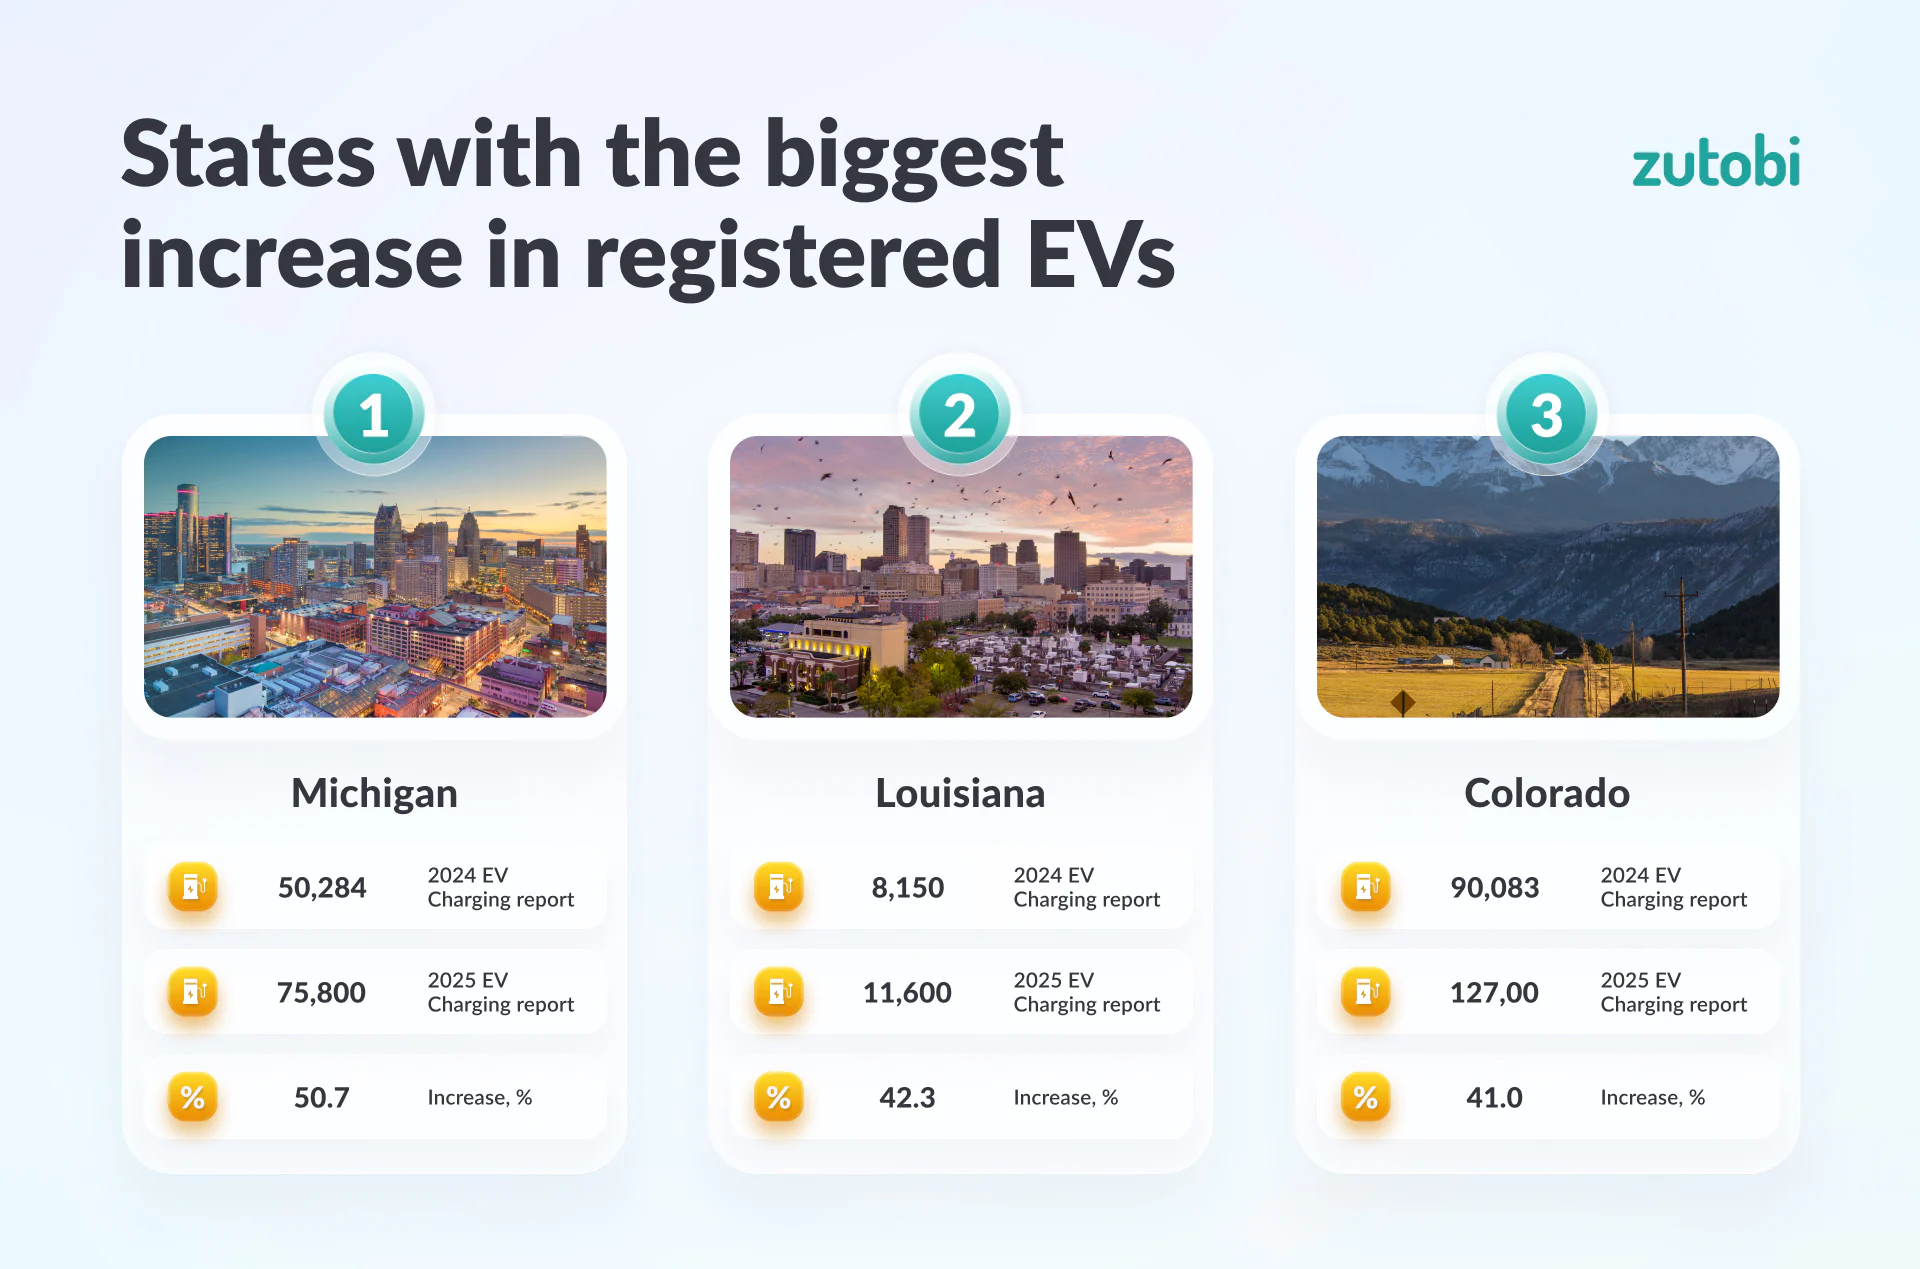
Place 1 – Michigan
Registered EVs in 2024: 50,284
Registered EVs in 2025: 75,800
Percentage growth: 50.7%
Michigan saw the largest growth in EV registrations, with a 50.7% increase. This boom can be attributed to both federal and state incentives, including tax rebates for EV purchases, as well as the expansion of charging infrastructure backed by major automakers headquartered in the state. Michigan’s success is particularly symbolic: the heart of the U.S. automotive industry is now leading the nation in EV adoption growth, driven by a strong manufacturing base and a workforce increasingly invested in the electric vehicle revolution.
Place 2 – Louisiana
Registered EVs in 2024: 8,150
Registered EVs in 2025: 11,600
Percentage growth: 42.3%
Louisiana has witnessed a significant 42.3% increase in electric vehicle registrations. This growth is a result of new EV-friendly policies, rising fuel costs that make EVs more economically attractive, and the state’s expanding charging network, which has made owning an electric vehicle more feasible for its residents. Louisiana is quickly emerging as a state to watch in the evolving EV landscape.
Place 3 – Colorado
Registered EVs in 2024: 90,083
Registered EVs in 2025: 127,000
Percentage growth: 41.0%
Colorado, already the second-highest state for EV adoption as a share of total vehicles, saw an impressive 41% growth in EV registrations. The state’s transition to electric vehicles is bolstered by generous state tax incentives stacked on top of federal credits, a high concentration of environmentally engaged residents, and a utility sector that has embraced time-of-use charging rates that significantly reduce the cost of charging at home.
States with the biggest increase in registered EVs
| № | State | Registered EVs (2024 Report) | Registered EVs (2025 Report) | Increase, % |
|---|---|---|---|---|
| 1 | Michigan | 50,284 | 75,800 | 50.7 |
| 2 | Louisiana | 8,150 | 11,600 | 42.3 |
| 3 | Colorado | 90,083 | 127,000 | 41.0 |
| 4 | Nevada | 47,361 | 65,600 | 38.5 |
| 5 | West Virginia | 2,758 | 3,800 | 37.8 |
| 6 | Ohio | 50,393 | 69,400 | 37.7 |
| 7 | South Dakota | 1,675 | 2,300 | 37.3 |
| 8 | Mississippi | 3,590 | 4,900 | 36.5 |
| 9 | North Dakota | 959 | 1,300 | 35.6 |
| 10 | Alabama | 13,047 | 17,500 | 34.1 |
| 11 | Arkansas | 7,108 | 9,500 | 33.7 |
| 12 | Indiana | 26,101 | 34,600 | 32.6 |
| 13 | Wyoming | 1,139 | 1,500 | 31.7 |
| 14 | Delaware | 8,435 | 11,100 | 31.6 |
| 15 | Maryland | 72,139 | 94,900 | 31.6 |
| 16 | Maine | 7,377 | 9,700 | 31.5 |
| 17 | Nebraska | 6,920 | 9,100 | 31.5 |
| 18 | Florida | 254,878 | 334,800 | 31.4 |
| 19 | Utah | 39,998 | 52,200 | 30.5 |
| 20 | Vermont | 7,816 | 10,200 | 30.5 |
| 21 | Georgia | 92,368 | 120,000 | 29.9 |
| 22 | Rhode Island | 6,396 | 8,300 | 29.8 |
| 23 | North Carolina | 70,164 | 91,000 | 29.7 |
| 24 | Iowa | 9,031 | 11,700 | 29.6 |
| 25 | Wisconsin | 24,943 | 32,300 | 29.5 |
| 26 | Idaho | 8,501 | 11,000 | 29.4 |
| 27 | Kentucky | 11,617 | 15,000 | 29.1 |
| 28 | New Jersey | 134,753 | 173,800 | 29.0 |
| 29 | New Hampshire | 9,861 | 12,700 | 28.8 |
| 30 | Kansas | 11,271 | 14,500 | 28.6 |
| 31 | South Carolina | 20,873 | 26,800 | 28.4 |
| 32 | Tennessee | 33,221 | 42,600 | 28.2 |
| 33 | Pennsylvania | 70,154 | 89,900 | 28.1 |
| 34 | New York | 131,250 | 168,100 | 28.1 |
| 35 | Texas | 230,125 | 294,700 | 28.1 |
| 36 | Minnesota | 37,050 | 47,400 | 27.9 |
| 37 | Missouri | 26,861 | 34,200 | 27.3 |
| 38 | New Mexico | 10,276 | 13,000 | 26.5 |
| 39 | Virginia | 84,936 | 107,400 | 26.4 |
| 40 | Alaska | 2,697 | 3,400 | 26.1 |
| 41 | Illinois | 99,573 | 125,500 | 26.0 |
| 42 | Washington | 152,101 | 191,400 | 25.8 |
| 43 | Dist. of Columbia | 8,066 | 10,100 | 25.2 |
| 44 | Connecticut | 31,557 | 39,400 | 24.9 |
| 45 | Arizona | 89,798 | 111,200 | 23.8 |
| 46 | Massachusetts | 73,768 | 91,100 | 23.5 |
| 47 | California | 1,256,646 | 1,533,900 | 22.1 |
| 48 | Oregon | 64,361 | 78,400 | 21.8 |
| 49 | Montana | 4,608 | 5,600 | 21.5 |
| 50 | Hawaii | 25,565 | 29,900 | 17.0 |
| 51 | Oklahoma | 22,843 | 22,600 | -1.1 |
States with the biggest increase in charging stations
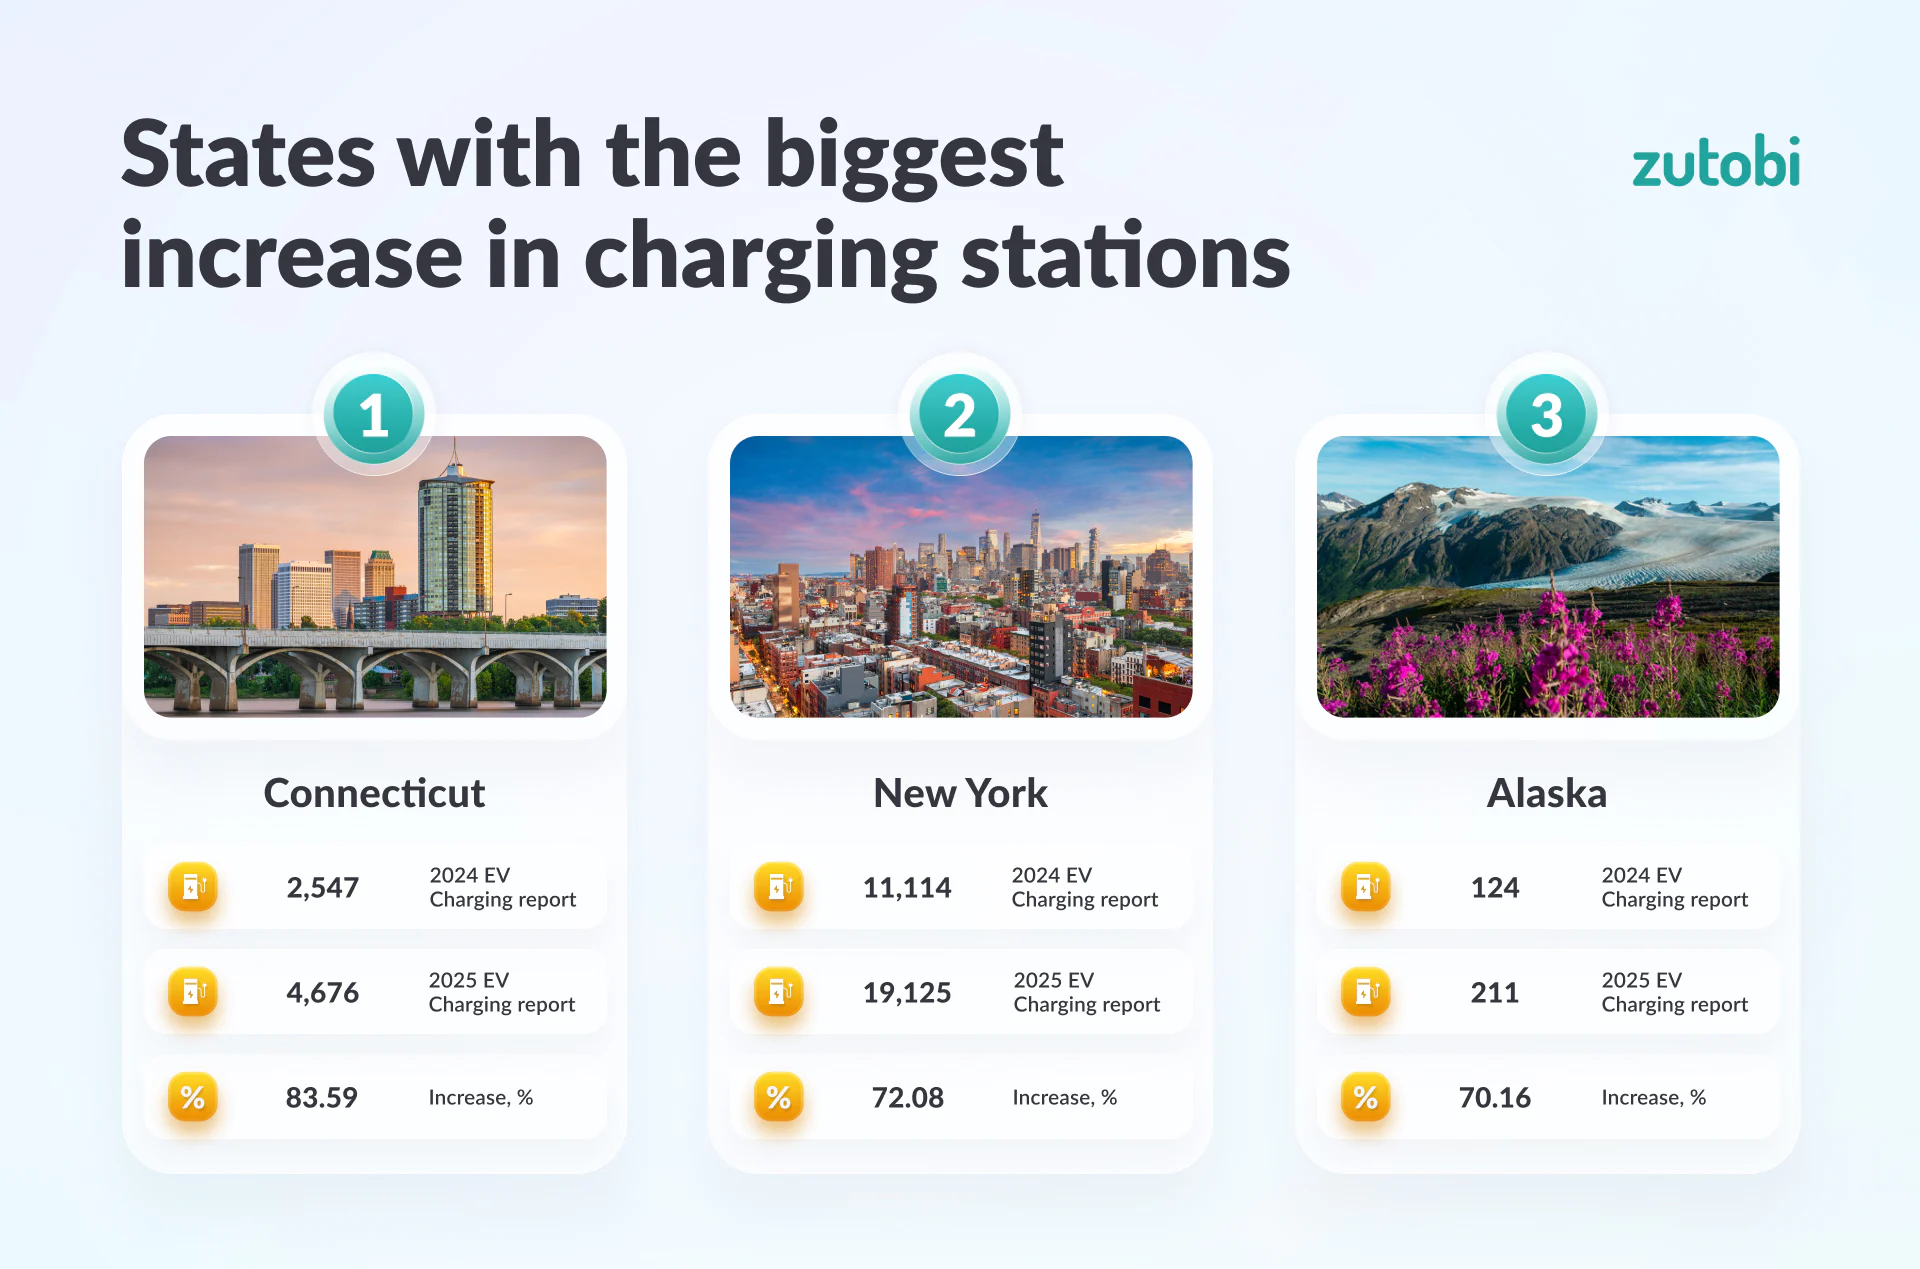
Place 1 – Connecticut
Charging points in 2024: 2,547
Charging points in 2025: 4,676
Percentage growth: 83.59%
Connecticut leads the charge with an 83.59% increase in charging stations, a testament to its aggressive push for cleaner transportation. The state’s focus on expanding infrastructure has helped make EV ownership more accessible and is setting a positive example for other states aiming to build a robust charging network. Connecticut also benefits from being part of regional multi-state clean transportation initiatives that have channeled funds toward electric mobility infrastructure.
Place 2 – New York
Charging points in 2024: 11,114
Charging points in 2025: 19,125
Percentage growth: 72.08%
New York saw a remarkable 72.08% increase in charging infrastructure over the past year, adding more than 8,000 public ports, the largest absolute increase of any state. This rapid growth is part of the state’s broader efforts to reduce emissions and support the adoption of electric vehicles. State utility programs, including initiatives that subsidize the installation of chargers in apartment buildings and workplaces, have been instrumental in driving this expansion.
Place 3 – Alaska
Charging points in 2024: 124
Charging points in 2025: 211
Percentage growth: 70.16%
Alaska’s charging infrastructure grew by 70.16%, reflecting a genuine commitment to building an EV-friendly environment even in one of the most challenging climates in the country. Federal NEVI funding has begun reaching Alaska’s key highway corridors, and Anchorage has seen meaningful urban charging expansion. This expansion is a key step toward ensuring that drivers in the Last Frontier have access to reliable charging options, and improvements in cold-weather battery technology are making the proposition increasingly viable.
States with the biggest increase in charging stations
| № | State | Total electric charging points (2024 Report) | Total electric charging points (2025 Report) | Increase, % |
|---|---|---|---|---|
| 1 | Connecticut | 2,547 | 4,676 | 83.59 |
| 2 | New York | 11,114 | 19,125 | 72.08 |
| 3 | Alaska | 124 | 211 | 70.16 |
| 4 | New Mexico | 695 | 1,154 | 66.04 |
| 5 | New Jersey | 3,723 | 5,946 | 59.71 |
| 6 | Michigan | 3,352 | 5,349 | 59.58 |
| 7 | Wisconsin | 1,398 | 2,196 | 57.08 |
| 8 | Illinois | 3,510 | 5,443 | 55.07 |
| 9 | Minnesota | 1,995 | 3,069 | 53.83 |
| 10 | Alabama | 1,096 | 1,684 | 53.65 |
| 11 | Massachusetts | 7,032 | 10,648 | 51.42 |
| 12 | Iowa | 855 | 1,283 | 50.06 |
| 13 | South Dakota | 232 | 345 | 48.71 |
| 14 | South Carolina | 1,374 | 2,034 | 48.03 |
| 15 | Maine | 1,084 | 1,604 | 47.97 |
| 16 | Georgia | 4,994 | 7,288 | 45.94 |
| 17 | Florida | 9,763 | 14,218 | 45.63 |
| 18 | Ohio | 3,653 | 5,201 | 42.38 |
| 19 | Vermont | 978 | 1,388 | 41.92 |
| 20 | Washington | 5,817 | 8,053 | 38.44 |
| 21 | Texas | 8,637 | 11,884 | 37.59 |
| 22 | Montana | 347 | 475 | 36.89 |
| 23 | Delaware | 523 | 712 | 36.14 |
| 24 | Tennessee | 2,225 | 3,011 | 35.33 |
| 25 | North Carolina | 4,204 | 5,681 | 35.13 |
| 26 | Indiana | 1,533 | 2,067 | 34.83 |
| 27 | Utah | 2,185 | 2,939 | 34.51 |
| 28 | Nevada | 1,987 | 2,652 | 33.47 |
| 29 | North Dakota | 209 | 278 | 33.01 |
| 30 | Colorado | 5,432 | 7,183 | 32.23 |
| 31 | Wyoming | 252 | 333 | 32.14 |
| 32 | Oregon | 3,190 | 4,189 | 31.32 |
| 33 | Kentucky | 849 | 1,108 | 30.51 |
| 34 | New Hampshire | 597 | 779 | 30.49 |
| 35 | Pennsylvania | 4,293 | 5,588 | 30.17 |
| 36 | Arkansas | 833 | 1,083 | 30.01 |
| 37 | Arizona | 3,506 | 4,556 | 29.95 |
| 38 | Idaho | 517 | 664 | 28.43 |
| 39 | California | 49,433 | 63,320 | 28.09 |
| 40 | Nebraska | 554 | 706 | 27.44 |
| 41 | West Virginia | 446 | 554 | 24.22 |
| 42 | Louisiana | 709 | 860 | 21.30 |
| 43 | Mississippi | 551 | 667 | 21.05 |
| 44 | Oklahoma | 1,363 | 1,617 | 18.64 |
| 45 | Missouri | 2,703 | 3,180 | 17.65 |
| 46 | Virginia | 4,565 | 5,351 | 17.22 |
| 47 | Hawaii | 860 | 972 | 13.02 |
| 48 | Kansas | 1,196 | 1,338 | 11.87 |
| 49 | Maryland | 5,022 | 5,416 | 7.85 |
| 50 | Rhode Island | 817 | 841 | 2.94 |
| 51 | Dist. of Columbia | 1,158 | 1,129 | -2.50 |
Methodology
The number of charging outlets in each state was sourced from the Alternative Fuels Data Center’s Alternative Fueling Station Count by State, taking the number of electric EVSE ports in each state.
The number of electric vehicles in each state was sourced from the Bureau of Transportation Statistics Electric Vehicle Registrations by State.The number of vehicles registered in each state was sourced from the Federal Highway Administration’s Highway Statistics and refers to the total number of private and commercial automobiles including taxicabs).
Previous reports
The 2022 EV Charging Station Report
The 2023 EV Charging Station Report
The 2024 EV Charging Station Report
Who is behind this study?
Zutobi is an online driver’s education company with the goal to make the roads a safer place. Instead of just helping students prepare for the permit test, our top priority is to teach about driving safety practices and driver safety to create better, and safer, drivers.

Take our full course with tests and theory
600+ exam-like questions and practice tests
Easy summarized DMV handbook
America’s #1 driver’s ed app with a 95.8% pass rate
Recommended articles


Ace your DMV test, guaranteed
Want to Be the Top School in Your Area?
- Simple & automated admin
- More time for teaching
- #1 learning materials for students
Start learning now
Resources
- Driver’s License Renewal
- How to Get Your US Driver’s License
- How to Prepare for Your Road Test
- How to Get a Driver’s Permit
- Behind-The-Wheel training
- Courses
- Blog
- FAQ
Show More
©2026 Zutobi AB, 4 Peddlers Row, Unit #103, Newark, DE 19702