loved by
15.1+ million
users

What State Drives The Fastest? Speeding Report
The National Highway Traffic Safety Administration (NHTSA) released a significant report on speeding and its impact on road safety. The report sheds light on the alarming increase in traffic-related fatalities caused by excessive speeding in recent years. Speeding is a dangerous behavior that poses a severe risk to drivers, passengers, and pedestrians alike. In this “Speeding Report,” we delve into the latest data to identify states with the highest incidence of speeding, examine the major causes contributing to this dangerous behavior, and analyze the trends in speeding-related accidents. By ranking each state from best to worst, we aim to raise awareness about the importance of responsible driving and the need for effective measures to address speeding and ensure safer roadways for everyone.
Note: Driving statistics take time to collect. This report features the latest data released in April 2026.
Is there any difference between gender and age?
The data shows that individuals aged 25-34 have demonstrated the highest tendency to be involved in fatal crashes involving speeding, with a total of 3,881 accidents reported for this age group.
Comparatively, drivers aged 15-24 showed slightly fewer violations, recording a total of 3,797 accidents throughout the year. The 55-75+ age group recorded 3,233 individuals involved in speeding-related fatal crashes, while the 35-44 age group had 2,869 accidents, and the 45-54 age group experienced 2,112 accidents over the same period.
Throughout the year, male drivers were involved in speeding-related fatal crashes 12,515 times, while female drivers experienced such accidents at a significantly lower rate — nearly 72% less, with 3,445 occurrences. It is evident that male drivers are leading in fatal crashes involving speeding in all of the listed states.
Breakdown by States
| State | Male Drivers in Fatal Crashes Involving Speeding | Female Drivers in Fatal Crashes Involving Speeding | Total |
|---|---|---|---|
| Alabama | 269 | 81 | 350 |
| Alaska | 40 | 12 | 52 |
| Arizona | 579 | 136 | 715 |
| Arkansas | 133 | 40 | 173 |
| California | 1368 | 342 | 1710 |
| Colorado | 288 | 63 | 351 |
| Connecticut | 142 | 25 | 167 |
| Delaware | 36 | 8 | 44 |
| District of Columbia | 21 | 3 | 24 |
| Florida | 410 | 111 | 521 |
| Georgia | 328 | 110 | 438 |
| Hawaii | 49 | 14 | 63 |
| Idaho | 58 | 14 | 72 |
| Illinois | 479 | 142 | 621 |
| Indiana | 250 | 72 | 322 |
| Iowa | 71 | 17 | 88 |
| Kansas | 72 | 22 | 94 |
| Kentucky | 91 | 30 | 121 |
| Louisiana | 219 | 62 | 281 |
| Maine | 46 | 10 | 56 |
| Maryland | 132 | 48 | 180 |
| Massachusetts | 123 | 33 | 156 |
| Michigan | 296 | 81 | 377 |
| Minnesota | 154 | 46 | 200 |
| Mississippi | 124 | 41 | 165 |
| Missouri | 344 | 93 | 437 |
| Montana | 93 | 33 | 126 |
| Nebraska | 68 | 19 | 87 |
| Nevada | 162 | 50 | 212 |
| New Hampshire | 48 | 13 | 61 |
| New Jersey | 185 | 65 | 250 |
| New Mexico | 167 | 42 | 209 |
| New York | 371 | 83 | 454 |
| North Carolina | 730 | 221 | 951 |
| North Dakota | 19 | 6 | 25 |
| Ohio | 203 | 45 | 248 |
| Oklahoma | 247 | 86 | 333 |
| Oregon | 176 | 45 | 221 |
| Pennsylvania | 513 | 132 | 645 |
| Rhode Island | 18 | 2 | 20 |
| South Carolina | 395 | 112 | 507 |
| South Dakota | 36 | 5 | 41 |
| Tennessee | 234 | 65 | 299 |
| Texas | 1719 | 483 | 2202 |
| Utah | 94 | 20 | 114 |
| Vermont | 18 | 13 | 31 |
| Virginia | 303 | 84 | 387 |
| Washington | 276 | 81 | 357 |
| West Virginia | 81 | 18 | 99 |
| Wisconsin | 191 | 56 | 247 |
| Wyoming | 46 | 10 | 56 |
| Total | 12515 | 3445 | 15960 |
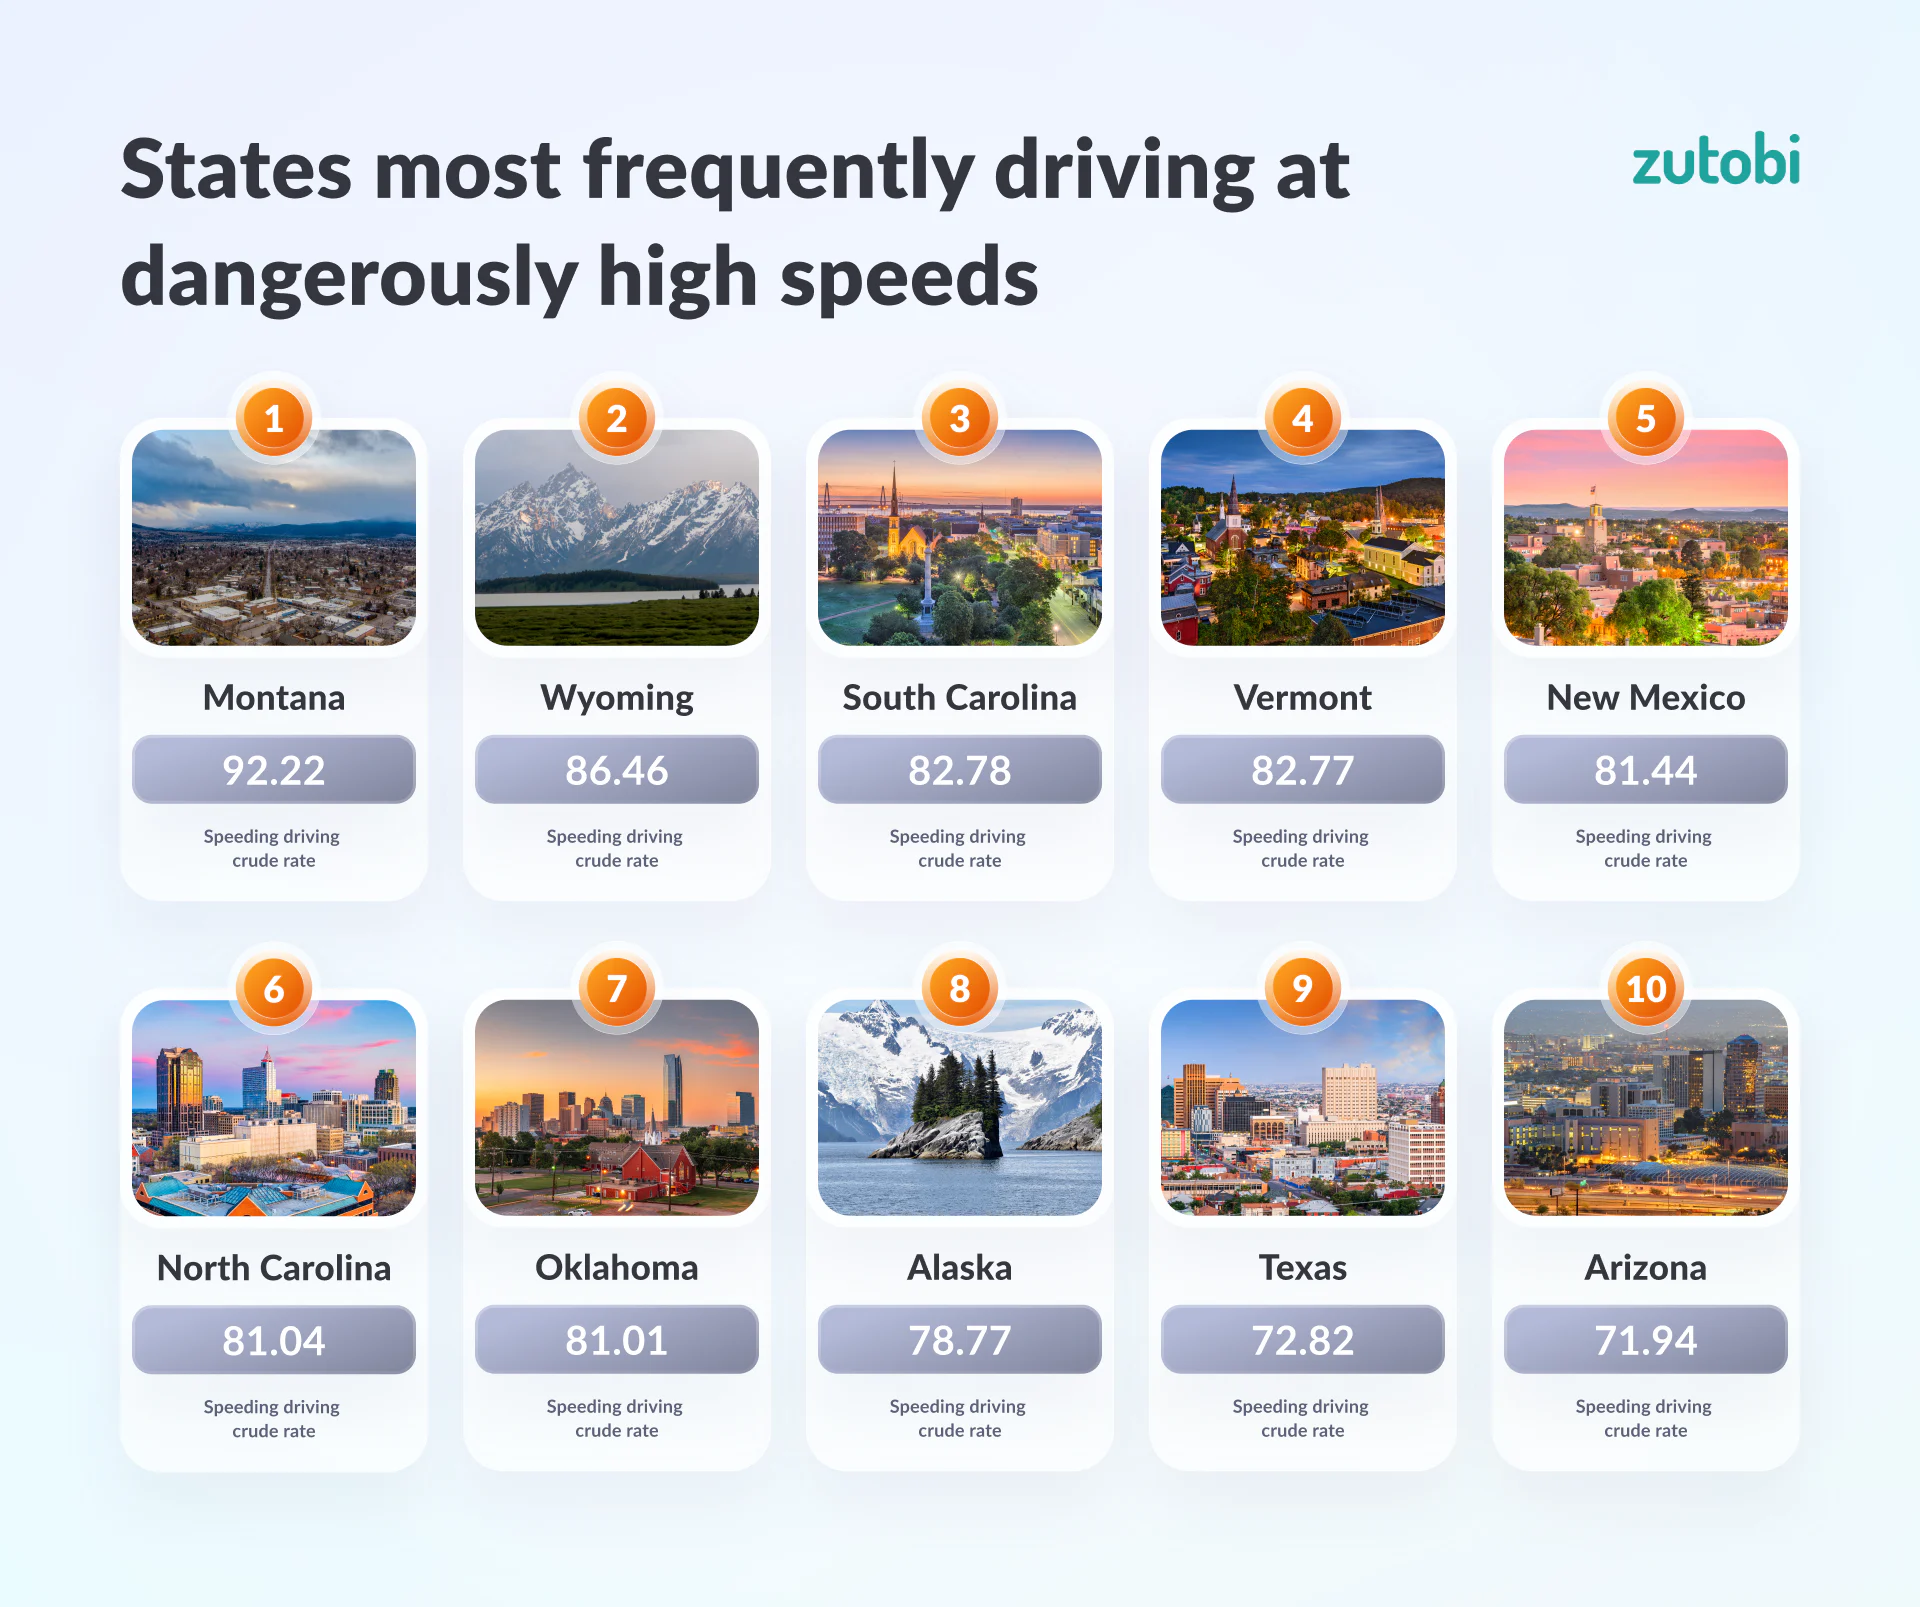
States most frequently driving at dangerously high speeds
Montana leads the nation with the highest speeding-related fatality rate, achieving a concerning Involving Speeding Driving Crude Rate of 92.22. This data underscores the urgency of addressing speeding-related issues to improve road safety in the state.
The second worst state is Wyoming with a crude rate of 86.46, followed by South Carolina (82.78), Vermont (82.77), New Mexico (81.44), North Carolina (81.04), Oklahoma (81.01), Alaska (78.77), Texas (72.82), and Arizona (71.94).
States with the least speeding
Florida had the lowest speeding-related fatality rate with an Involving Speeding Driving Crude Rate of 20.86. These best performers were followed by Ohio (27.55), Kentucky (29.47), Maryland (32.09), New Jersey (33.03), Iowa (33.54), Massachusetts (37.35), North Dakota (37.76), Tennessee (38.46), and Rhode Island (38.89).
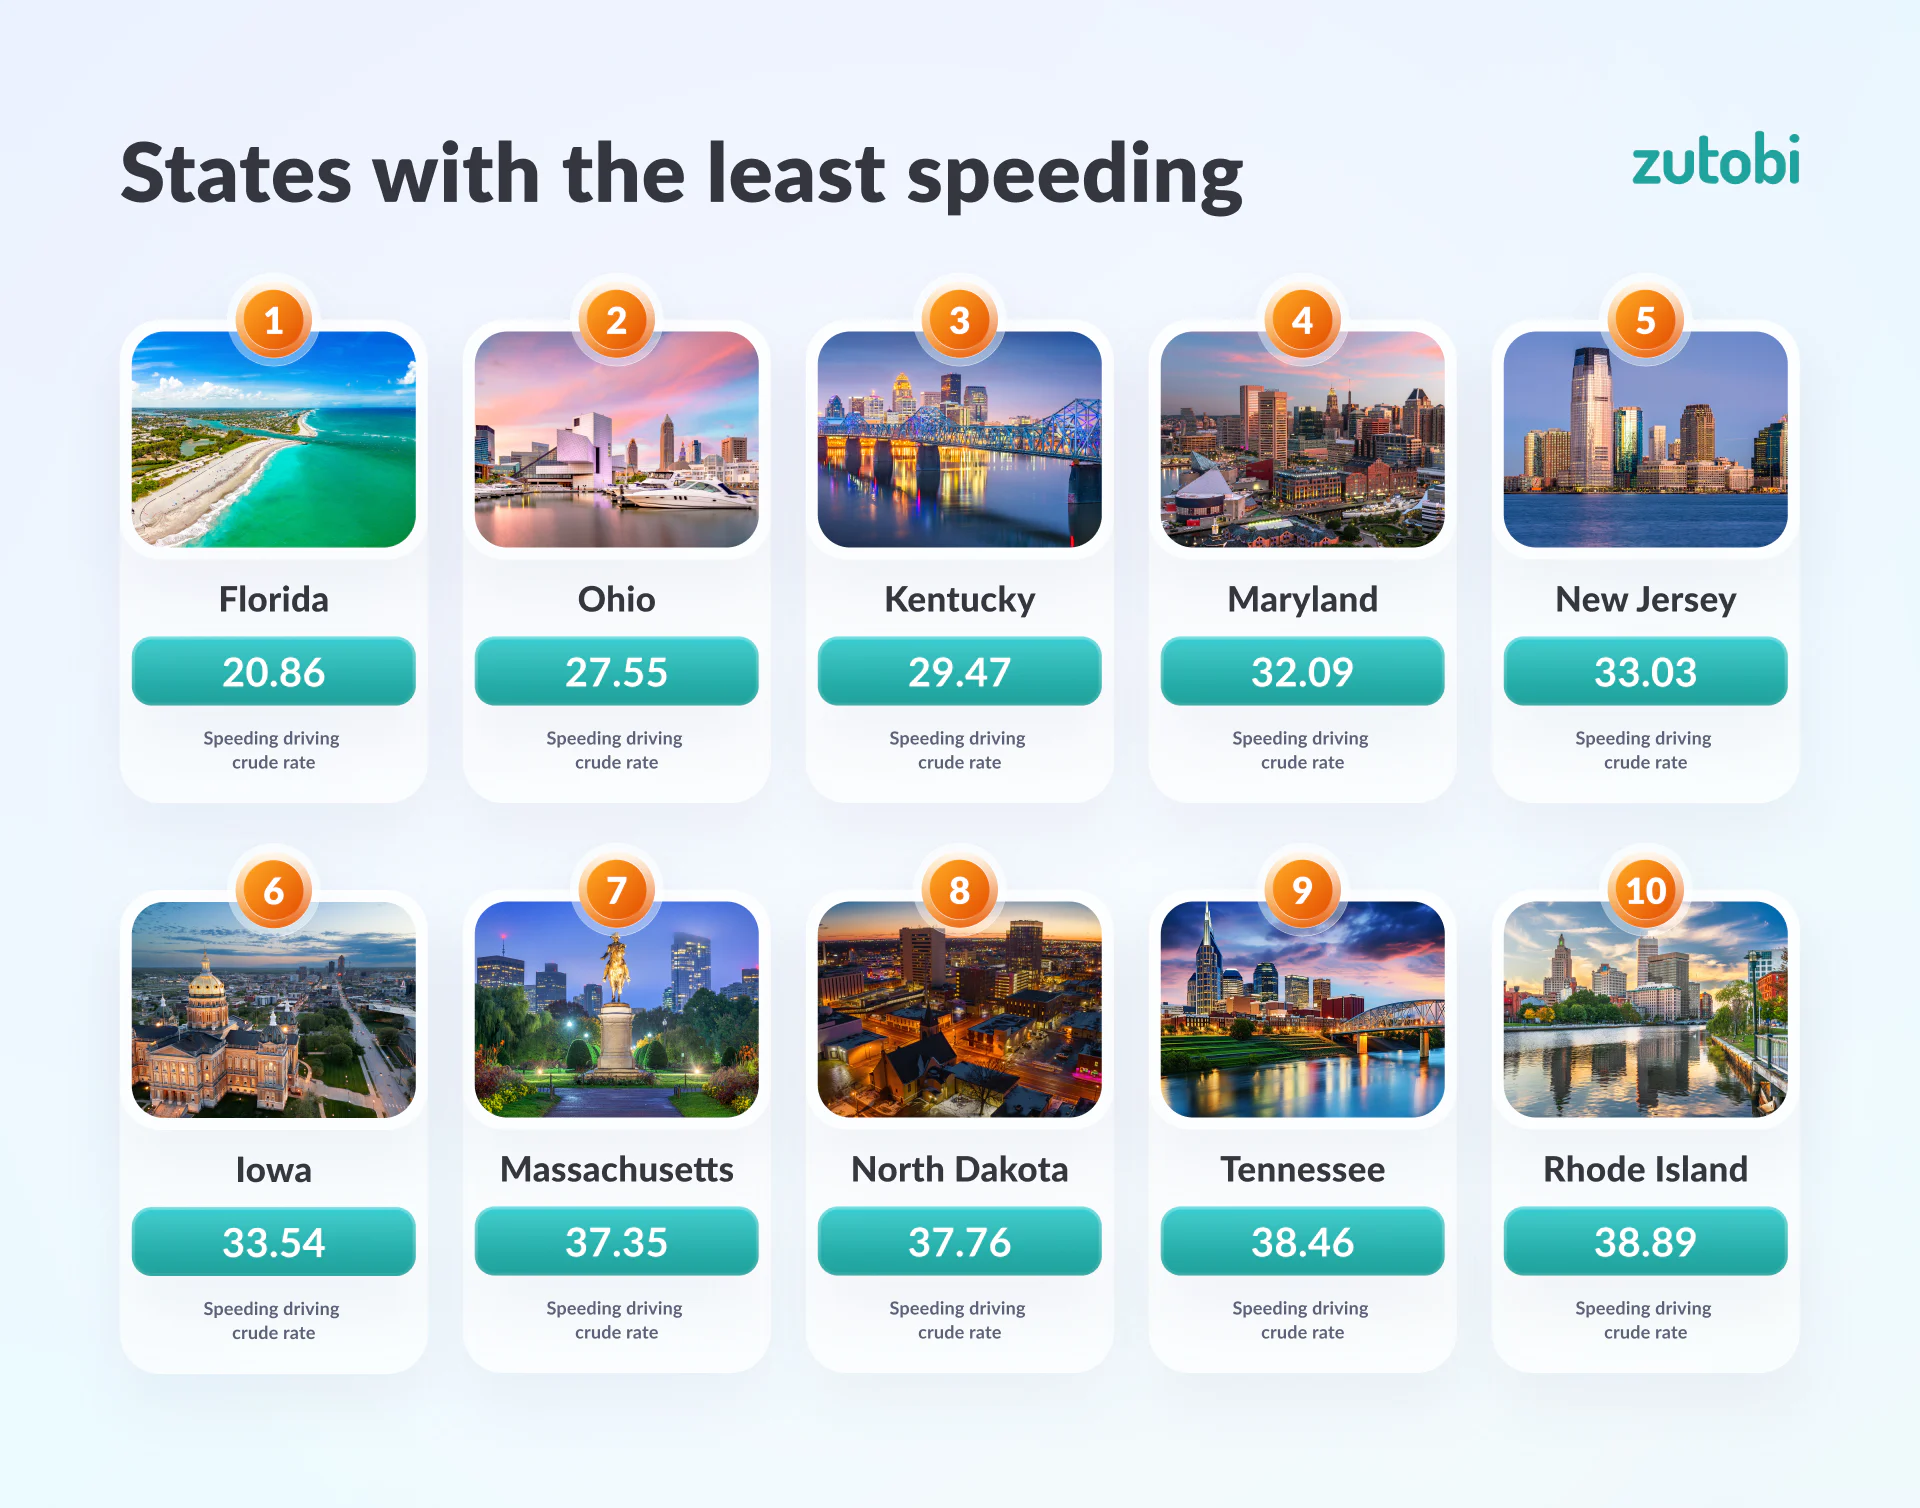
The substantial variation in speeding-related crashes may, in part, be attributed to variations in state guidelines for reporting such accidents. Additionally, it could be the outcome of dedicated efforts by local governments to address speeding through measures like enhanced enforcement, awareness campaigns, and other safety initiatives.
The complete list of speeding statistics for each state
State | Total Deaths in Fatal Crashes Involving Speeding | Speed involving Deaths per 100 000 licensed drivers | Total fatal crashes | Total Number of Fatal Involving Speeding crashes/Total fatal crashes | Involving Speeding Driving Crude Rate |
|---|---|---|---|---|---|
| Florida | 360 | 2.10 | 2931 | 10.68% | 20.86 |
| Ohio | 192 | 2.24 | 1077 | 16.81% | 27.55 |
| Kentucky | 94 | 3.39 | 663 | 12.97% | 29.47 |
| Maryland | 113 | 2.61 | 552 | 19.57% | 32.09 |
| New Jersey | 153 | 2.20 | 638 | 22.57% | 33.03 |
| Iowa | 70 | 2.93 | 324 | 19.44% | 33.54 |
| Massachusetts | 104 | 2.09 | 349 | 27.51% | 37.35 |
| North Dakota | 20 | 3.39 | 84 | 21.43% | 37.76 |
| Tennessee | 224 | 4.33 | 1093 | 17.38% | 38.46 |
| Rhode Island | 16 | 2.08 | 48 | 29.17% | 38.89 |
| Kansas | 70 | 4.01 | 314 | 20.06% | 39.51 |
| Delaware | 31 | 3.42 | 121 | 23.14% | 39.59 |
| Maine | 42 | 3.88 | 167 | 22.75% | 41.49 |
| Michigan | 277 | 3.54 | 1011 | 25.22% | 42.26 |
| Idaho | 56 | 3.95 | 219 | 25.11% | 44.19 |
| Georgia | 339 | 4.33 | 1312 | 23.40% | 44.34 |
| Minnesota | 138 | 3.27 | 431 | 29.00% | 44.63 |
| South Dakota | 33 | 4.73 | 134 | 22.39% | 45.35 |
| Arkansas | 139 | 4.68 | 547 | 22.85% | 45.56 |
| New York | 364 | 2.93 | 1036 | 32.05% | 45.91 |
| New Hampshire | 39 | 3.56 | 120 | 30.00% | 47.06 |
| Nebraska | 69 | 4.64 | 223 | 24.66% | 47.15 |
| Utah | 83 | 3.60 | 251 | 30.68% | 47.88 |
| Mississippi | 131 | 6.29 | 678 | 17.26% | 48.03 |
| Indiana | 219 | 4.55 | 785 | 26.24% | 48.22 |
| California | 1139 | 4.09 | 3583 | 28.77% | 48.47 |
| Wisconsin | 189 | 4.22 | 529 | 31.00% | 51.30 |
| Washington | 248 | 4.09 | 674 | 32.94% | 52.56 |
| Oregon | 163 | 5.12 | 491 | 28.92% | 53.70 |
| Virginia | 285 | 4.75 | 867 | 30.80% | 53.72 |
| Louisiana | 208 | 6.08 | 705 | 25.82% | 55.37 |
| District of Columbia | 18 | 4.26 | 46 | 36.96% | 57.34 |
| Illinois | 423 | 4.81 | 1085 | 34.65% | 57.76 |
| Colorado | 237 | 5.23 | 642 | 33.49% | 58.70 |
| Nevada | 136 | 5.89 | 378 | 31.75% | 60.28 |
| Pennsylvania | 437 | 4.80 | 1060 | 37.36% | 60.37 |
| Connecticut | 126 | 4.78 | 285 | 38.60% | 61.51 |
| Hawaii | 43 | 4.48 | 97 | 41.24% | 62.61 |
| West Virginia | 78 | 6.80 | 238 | 30.25% | 63.27 |
| Alabama | 278 | 7.30 | 895 | 29.39% | 64.89 |
| Missouri | 311 | 7.18 | 882 | 32.65% | 67.51 |
| Arizona | 446 | 7.56 | 1118 | 35.24% | 71.94 |
| Texas | 1496 | 7.65 | 3774 | 35.67% | 72.82 |
| Alaska | 35 | 6.48 | 63 | 47.62% | 78.77 |
| Oklahoma | 237 | 9.24 | 594 | 36.03% | 81.01 |
| North Carolina | 676 | 8.29 | 1509 | 40.82% | 81.04 |
| New Mexico | 148 | 9.39 | 378 | 35.71% | 81.44 |
| Vermont | 32 | 6.63 | 53 | 50.94% | 82.77 |
| South Carolina | 392 | 9.44 | 948 | 36.81% | 82.78 |
| Wyoming | 42 | 9.32 | 102 | 41.18% | 86.46 |
| Montana | 89 | 10.12 | 193 | 43.01% | 92.22 |
States with the most improved speeding record
Rhode Island leads the country, cutting speeding-related deaths in half — from 32 to 16 — with the per-100,000 rate falling from 4.20 to 2.08 and the share of fatal crashes dropping from 41.79% to 29.17%. Maryland and Delaware follow, each reducing total deaths by more than 30%. Among larger states, Ohio recorded the biggest absolute reduction in the top ten, with 63 fewer deaths in 2024 than the year before.
| # | State | Deaths 2023 | Deaths 2024 | Change in deaths | Per 100k 2023 | Per 100k 2024 | % of fatal 2023 | % of fatal 2024 |
|---|---|---|---|---|---|---|---|---|
| 1 | Rhode Island | 32 | 16 | -50.0% | 4.20 | 2.08 | 41.79% | 29.17% |
| 2 | Maryland | 187 | 113 | -39.6% | 4.32 | 2.61 | 28.60% | 19.57% |
| 3 | Delaware | 45 | 31 | -31.1% | 5.08 | 3.42 | 32.03% | 23.14% |
| 4 | Wyoming | 57 | 42 | -26.3% | 12.92 | 9.32 | 41.32% | 41.18% |
| 5 | Ohio | 255 | 192 | -24.7% | 3.02 | 2.24 | 20.61% | 16.81% |
| 6 | Kentucky | 119 | 94 | -21.0% | 3.97 | 3.39 | 14.34% | 12.97% |
| 7 | Hawaii | 54 | 43 | -20.4% | 5.72 | 4.48 | 55.68% | 41.24% |
| 8 | Iowa | 87 | 70 | -19.5% | 3.66 | 2.93 | 21.34% | 19.44% |
| 9 | New Jersey | 190 | 153 | -19.5% | 2.77 | 2.20 | 29.84% | 22.57% |
| 10 | North Dakota | 24 | 20 | -16.7% | 4.13 | 3.39 | 25.00% | 21.43% |
States heading in the wrong direction
Not every state is moving the right way. Vermont saw the steepest deterioration, with speeding-related deaths jumping from 19 to 32 — a 68% increase — and the share of fatal crashes involving speeding nearly doubling, from 26.98% to 50.94%. Nevada and Nebraska followed, each recording roughly 50% more deaths. In absolute terms, Nevada added the most fatalities of any state in this group, with 48 additional deaths in 2024.
| # | State | Deaths 2023 | Deaths 2024 | Change in deaths | Per 100k 2023 | Per 100k 2024 | % of fatal 2023 | % of fatal 2024 |
|---|---|---|---|---|---|---|---|---|
| 1 | Vermont | 19 | 32 | +68.4% | 3.95 | 6.63 | 26.98% | 50.94% |
| 2 | Nevada | 88 | 136 | +54.5% | 3.90 | 5.89 | 23.08% | 31.75% |
| 3 | Nebraska | 46 | 69 | +50.0% | 3.16 | 4.64 | 21.36% | 24.66% |
| 4 | Alaska | 24 | 35 | +45.8% | 4.57 | 6.48 | 39.29% | 47.62% |
| 5 | New Hampshire | 30 | 39 | +30.0% | 2.75 | 3.56 | 21.31% | 30.00% |
| 6 | Connecticut | 104 | 126 | +21.2% | 3.95 | 4.78 | 32.87% | 38.60% |
| 7 | Minnesota | 116 | 138 | +19.0% | 2.79 | 3.27 | 28.11% | 29.00% |
| 8 | Alabama | 235 | 278 | +18.3% | 5.75 | 7.30 | 24.19% | 29.39% |
| 9 | Montana | 77 | 89 | +15.6% | 8.76 | 10.12 | 35.71% | 43.01% |
| 10 | New Mexico | 131 | 148 | +13.0% | 8.50 | 9.39 | 29.60% | 35.71% |
Figures are drawn from involving Speed Driving 2023 and 2024 latest data, which compile fatal-crash and licensed-driver counts for each jurisdiction. “Deaths per 100,000 licensed drivers” normalises the death count against each state’s licensed-driver population, and “% of fatal crashes” expresses speeding-involved fatal crashes as a proportion of all fatal crashes in that state.
Methodology
Data in this report has been gathered from different governmental websites, including the Fatality and Injury Reporting System Tool (FIRST) developed by NHTSA.
Previous Reports:

Take our full course with tests and theory
600+ exam-like questions and practice tests
Easy summarized DMV handbook
America’s #1 driver’s ed app with a 95.8% pass rate
Recommended articles


Ace your DMV test, guaranteed
Want to Be the Top School in Your Area?
- Simple & automated admin
- More time for teaching
- #1 learning materials for students
Start learning now
Resources
- Driver’s License Renewal
- How to Get Your US Driver’s License
- How to Prepare for Your Road Test
- How to Get a Driver’s Permit
- Behind-The-Wheel training
- Courses
- Blog
- FAQ
Show More
©2026 Zutobi AB, 4 Peddlers Row, Unit #103, Newark, DE 19702