loved by
15.1+ million
users
What Do the US’s Most Dangerous Drivers Look Like?
Globally, road accidents tragically claim a life every 30 seconds and result in 20 injuries. It’s essential to note that these incidents are not limited to drivers alone; pedestrians are also profoundly impacted. The latest data from the World Health Organization (WHO) reveals that over 270,000 pedestrians lose their lives on the world’s roads each year, constituting 22% of the total 1.24 million road traffic deaths.
The question that intrigues us all is, what defines a dangerous driver? Is it new drivers learning to drive, or seasoned drivers? To find out, we analyzed US road traffic accident data to create profiles of what a dangerous driver looks like – from their age and gender, to where they live.
Which gender is most likely to be involved in an accident?
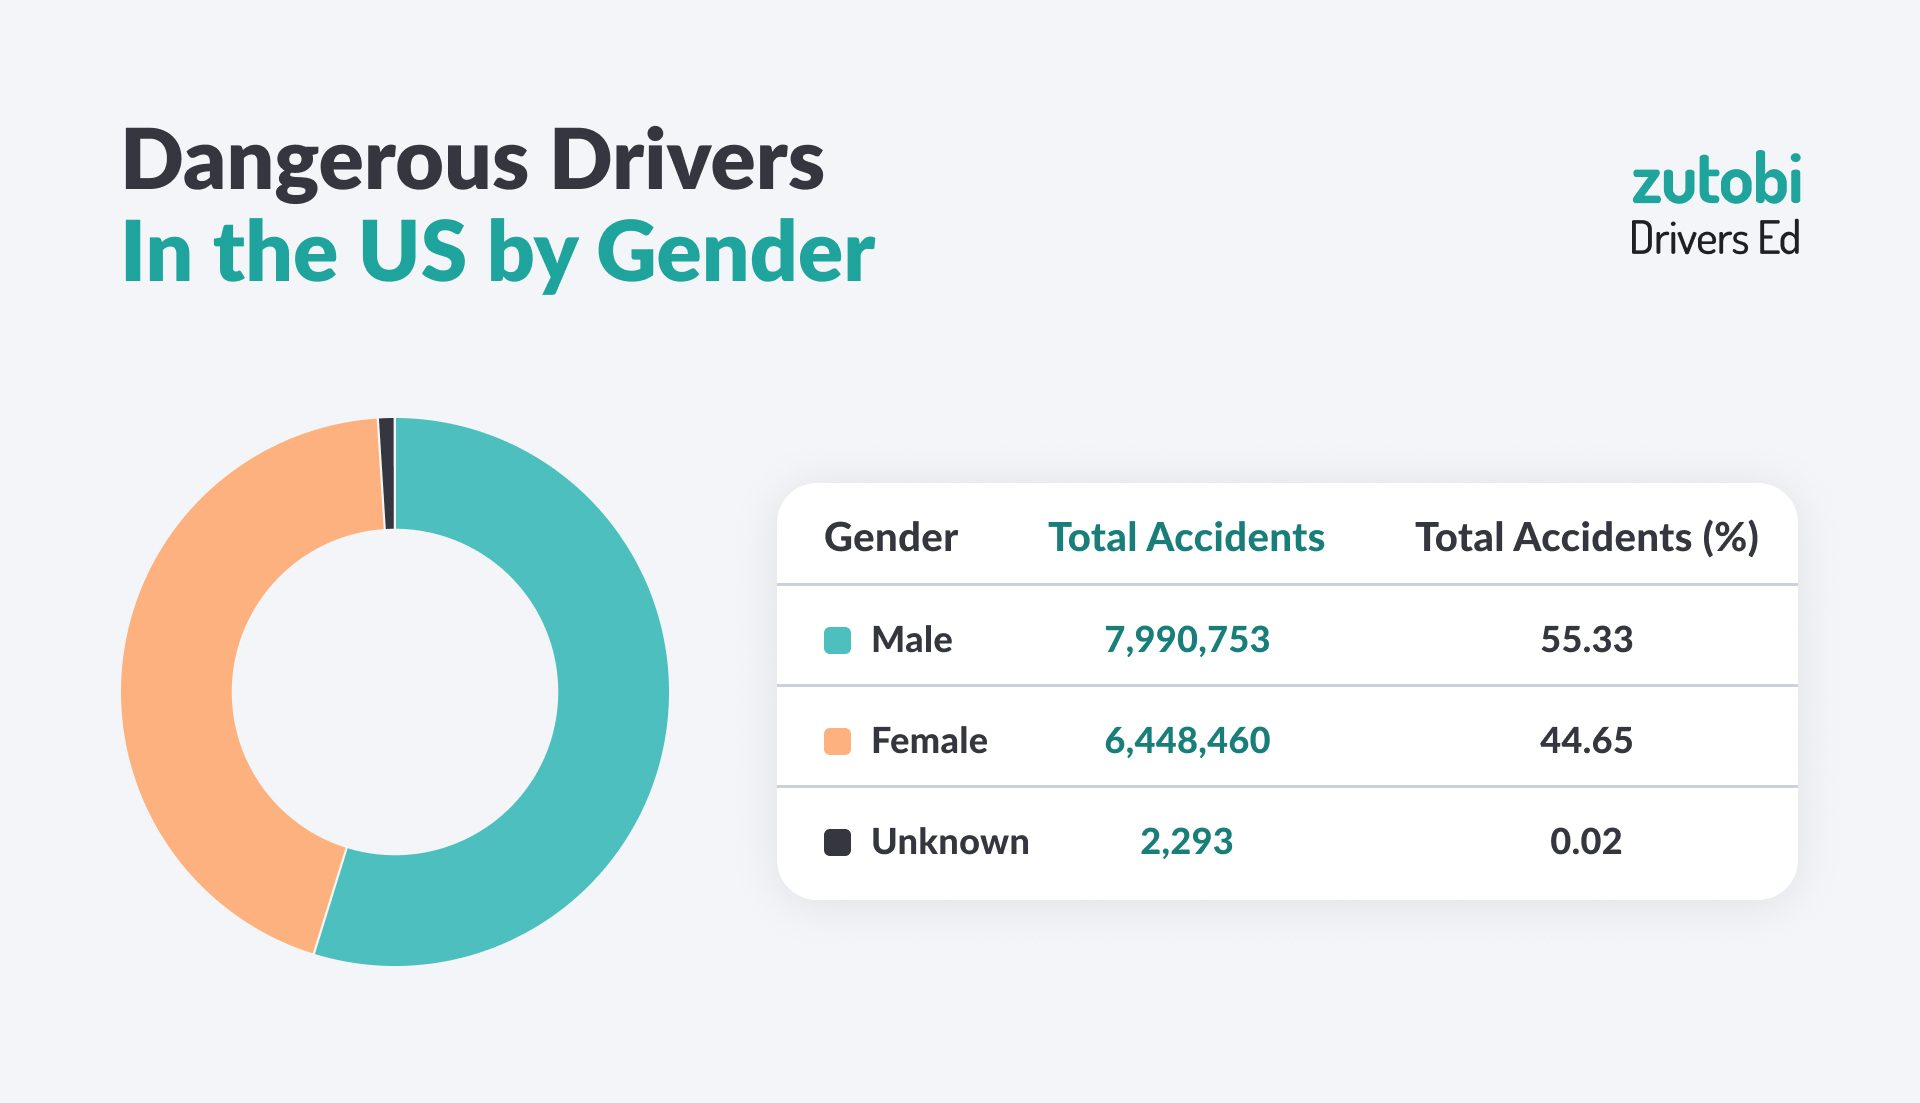
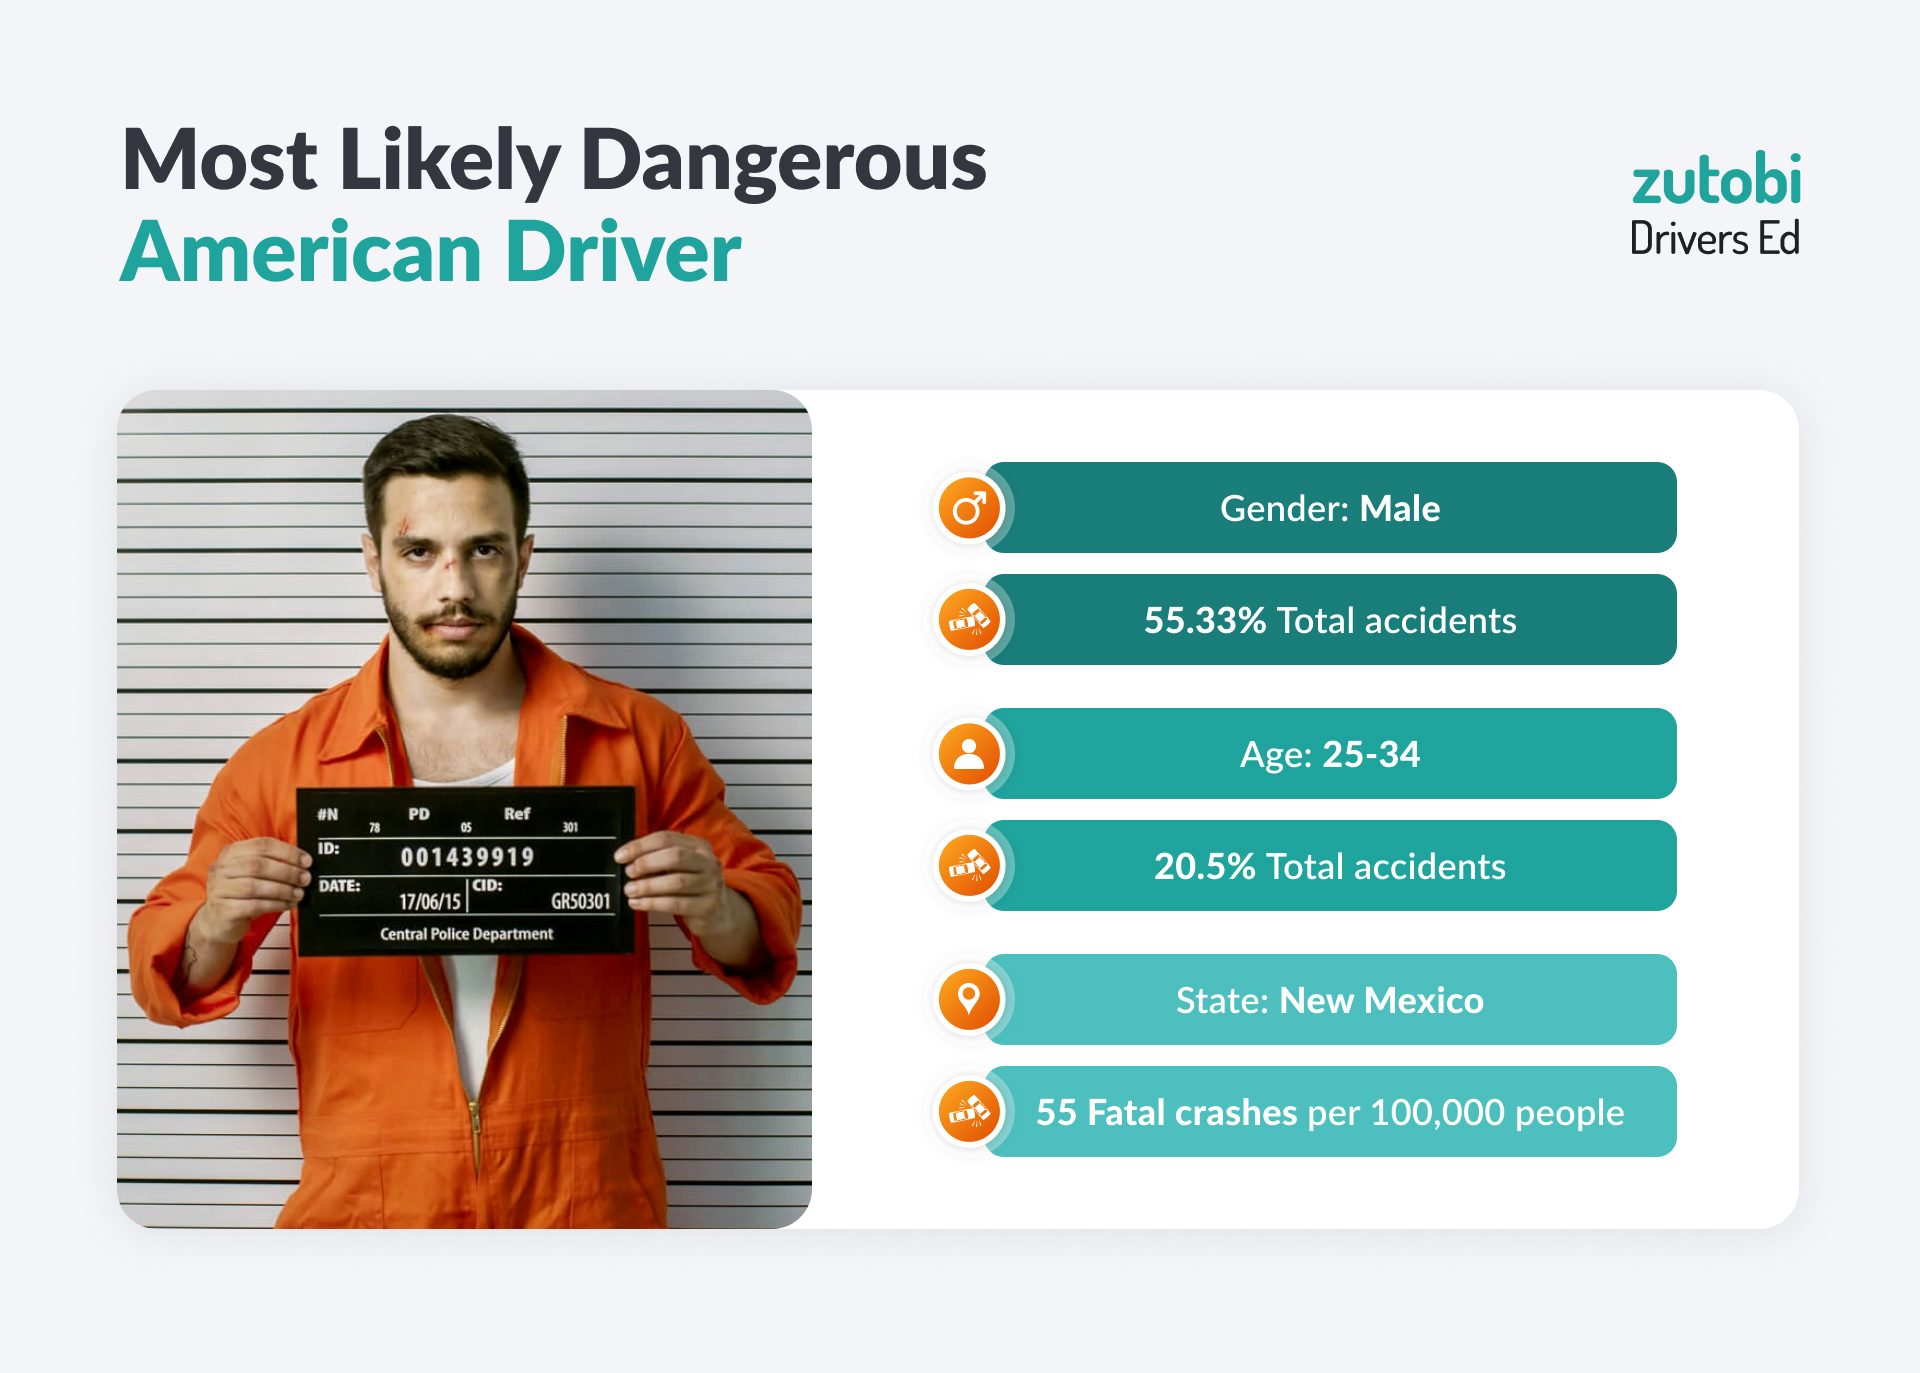
Gender often plays a significant role in determining motor insurance premiums, and regrettably, men typically face higher rates. In the USA, male drivers have a higher likelihood of being involved in accidents, accounting for 55.33% of all accidents, which is 10.68% more than their female counterparts. It’s important to note that while the total number of accidents involving men decreased from 8,806,635 to 7,990,753, the number of male drivers involved in accidents increased by just over 1%. Conversely, the percentage of women involved in accidents decreased by slightly more than 1%.
Which age group is most likely to be involved in an accident?
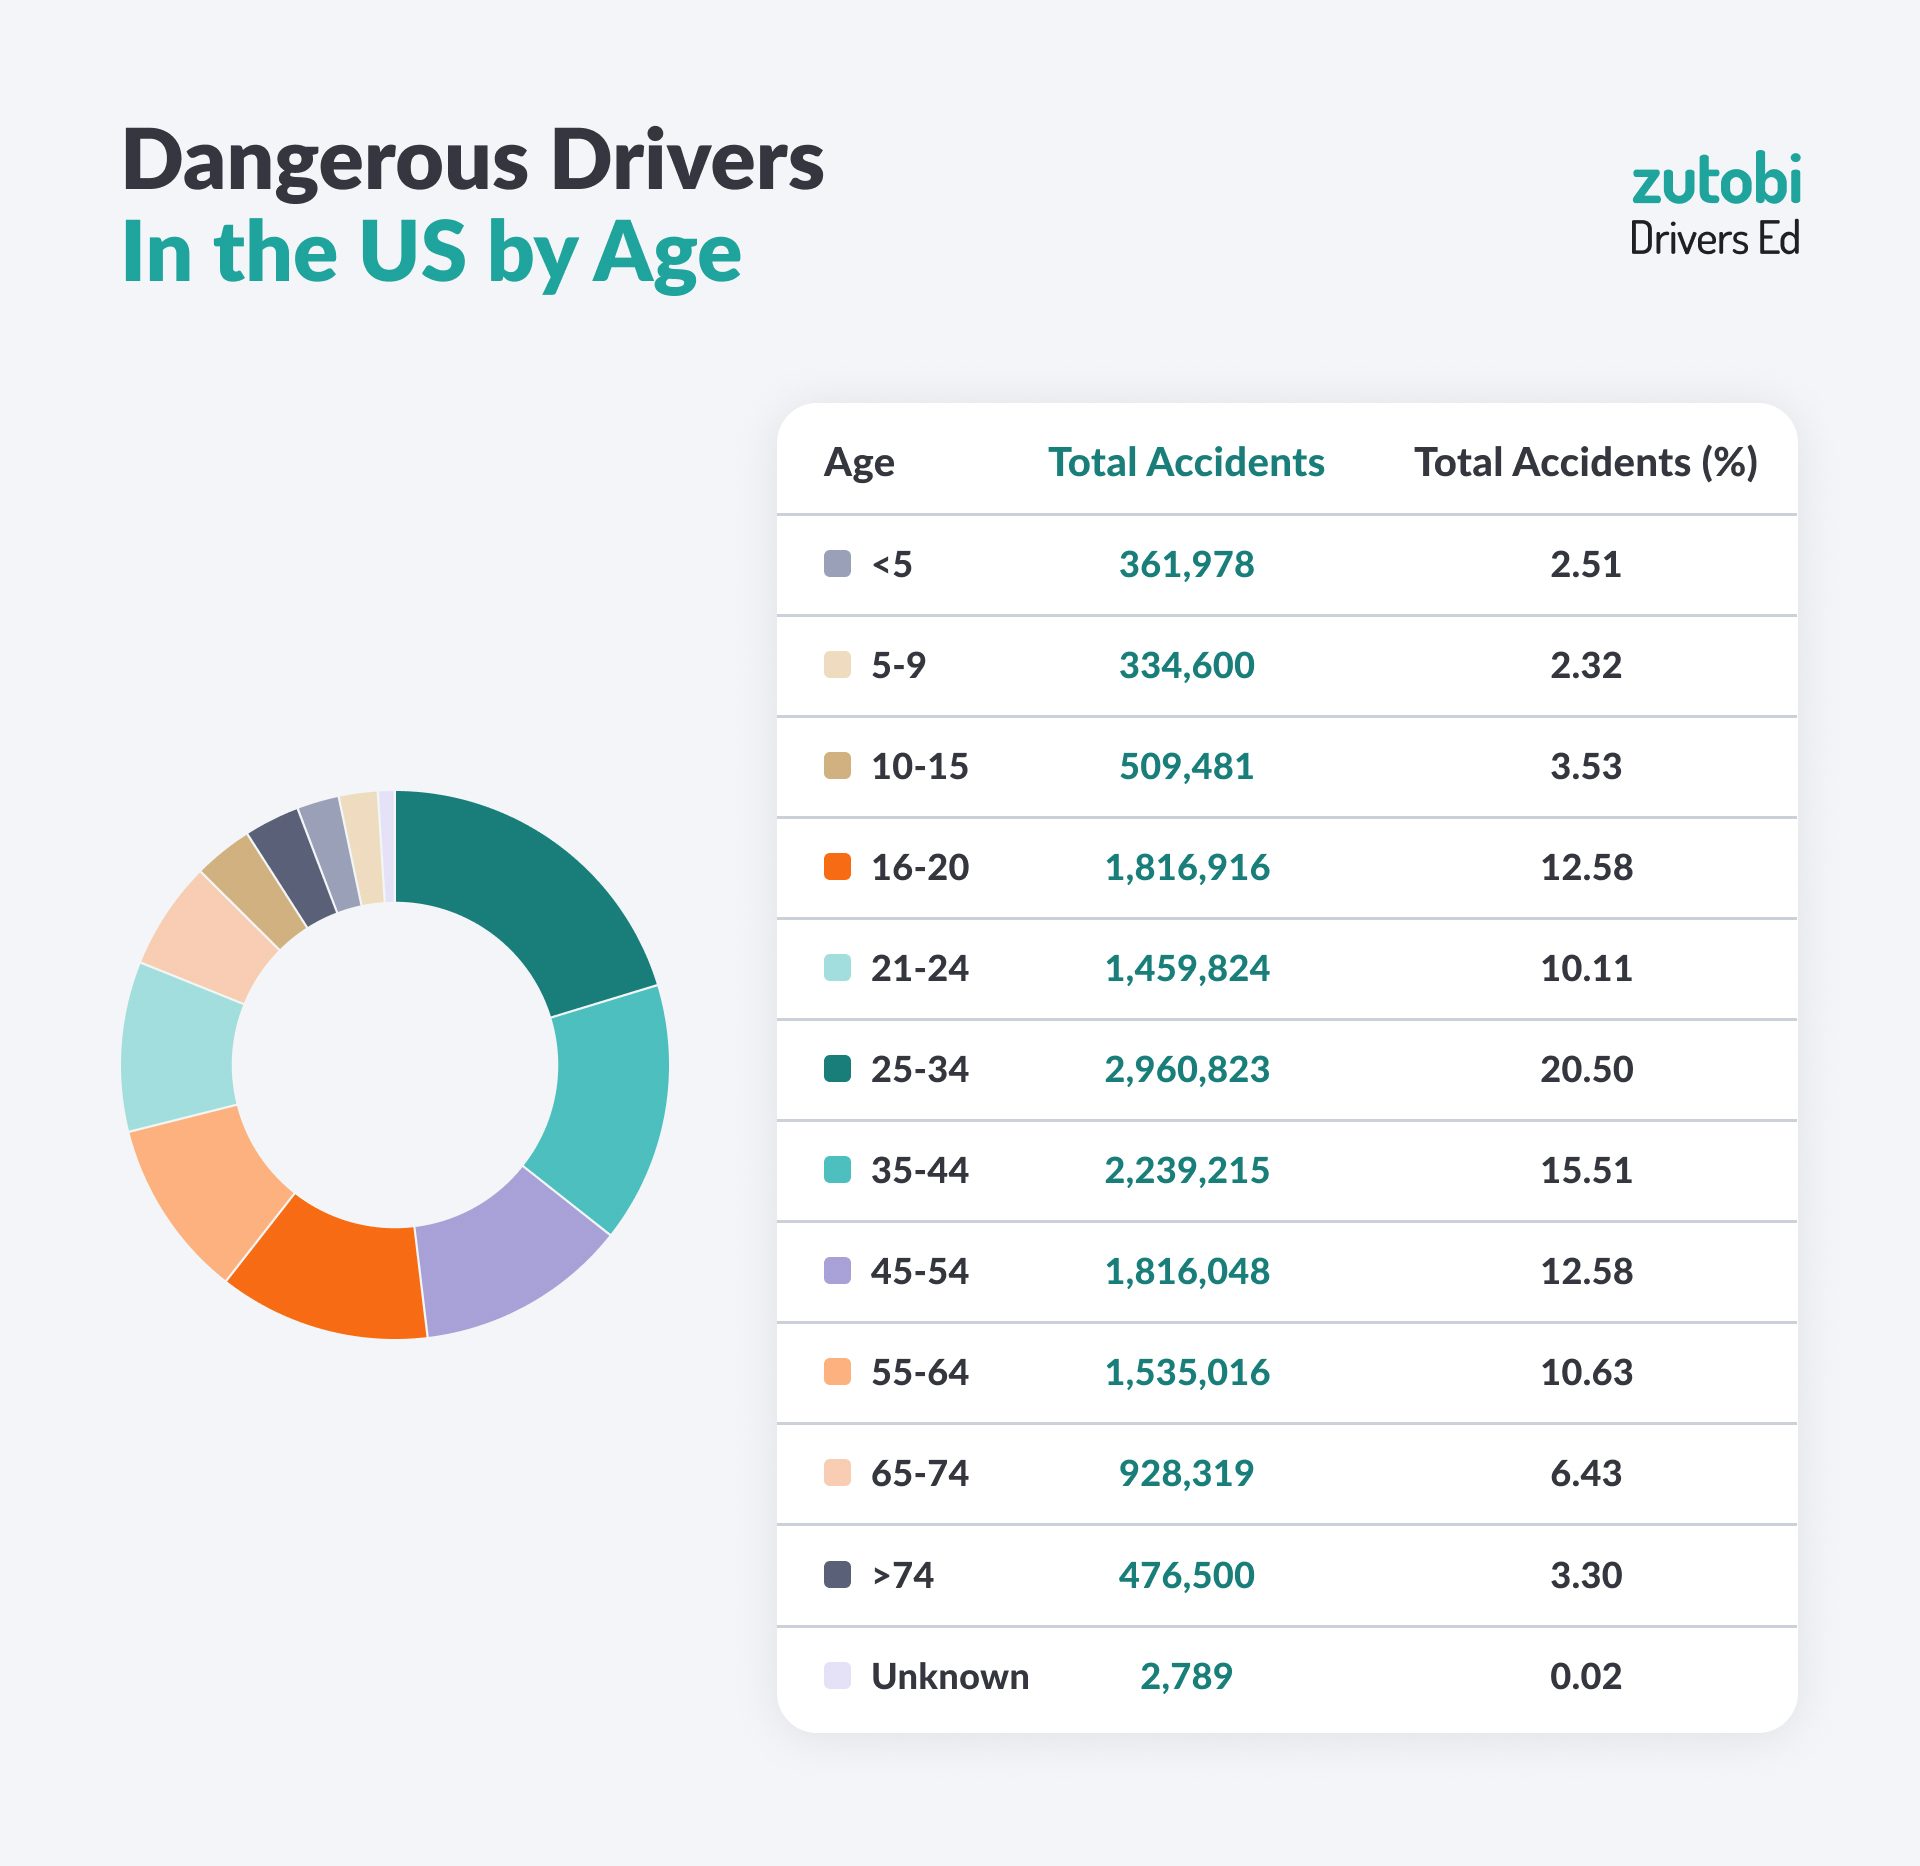
Individuals aged 25-34 are the most frequently involved in accidents, making up 20.5% of all accidents. New drivers in the 16-20 age group account for 12.58% of total accidents, marking a 1% increase compared to the previous year, translating to approximately 1.8 million accidents annually.
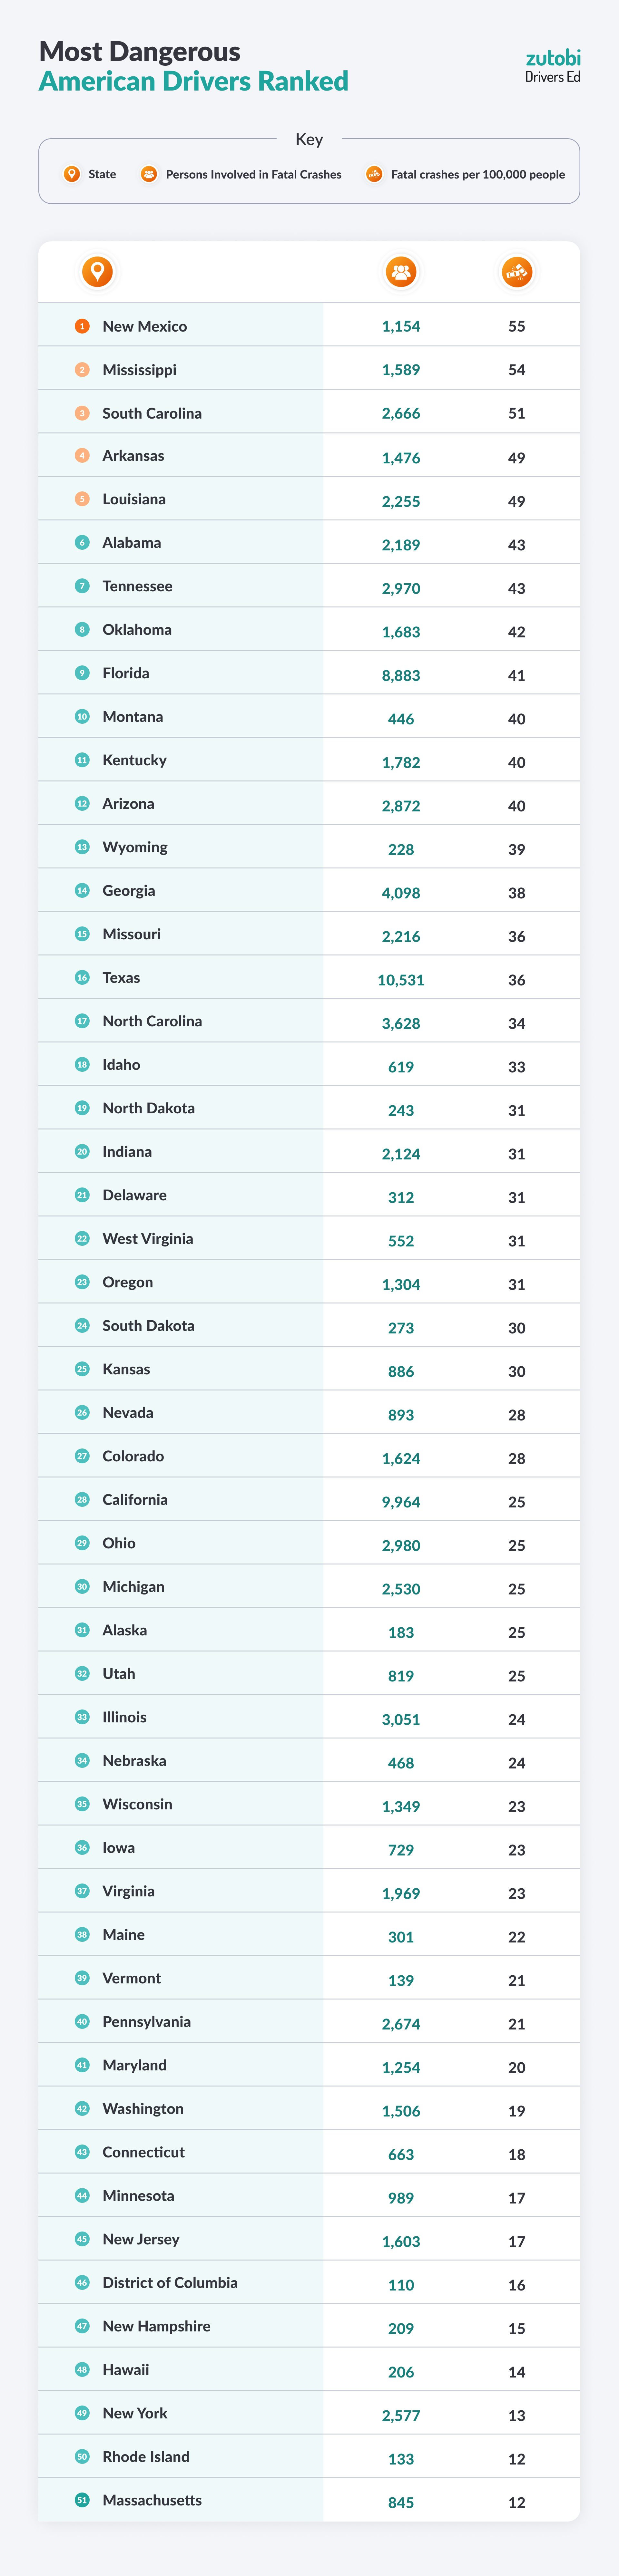
Which states are most likely to be involved in a fatal accident?
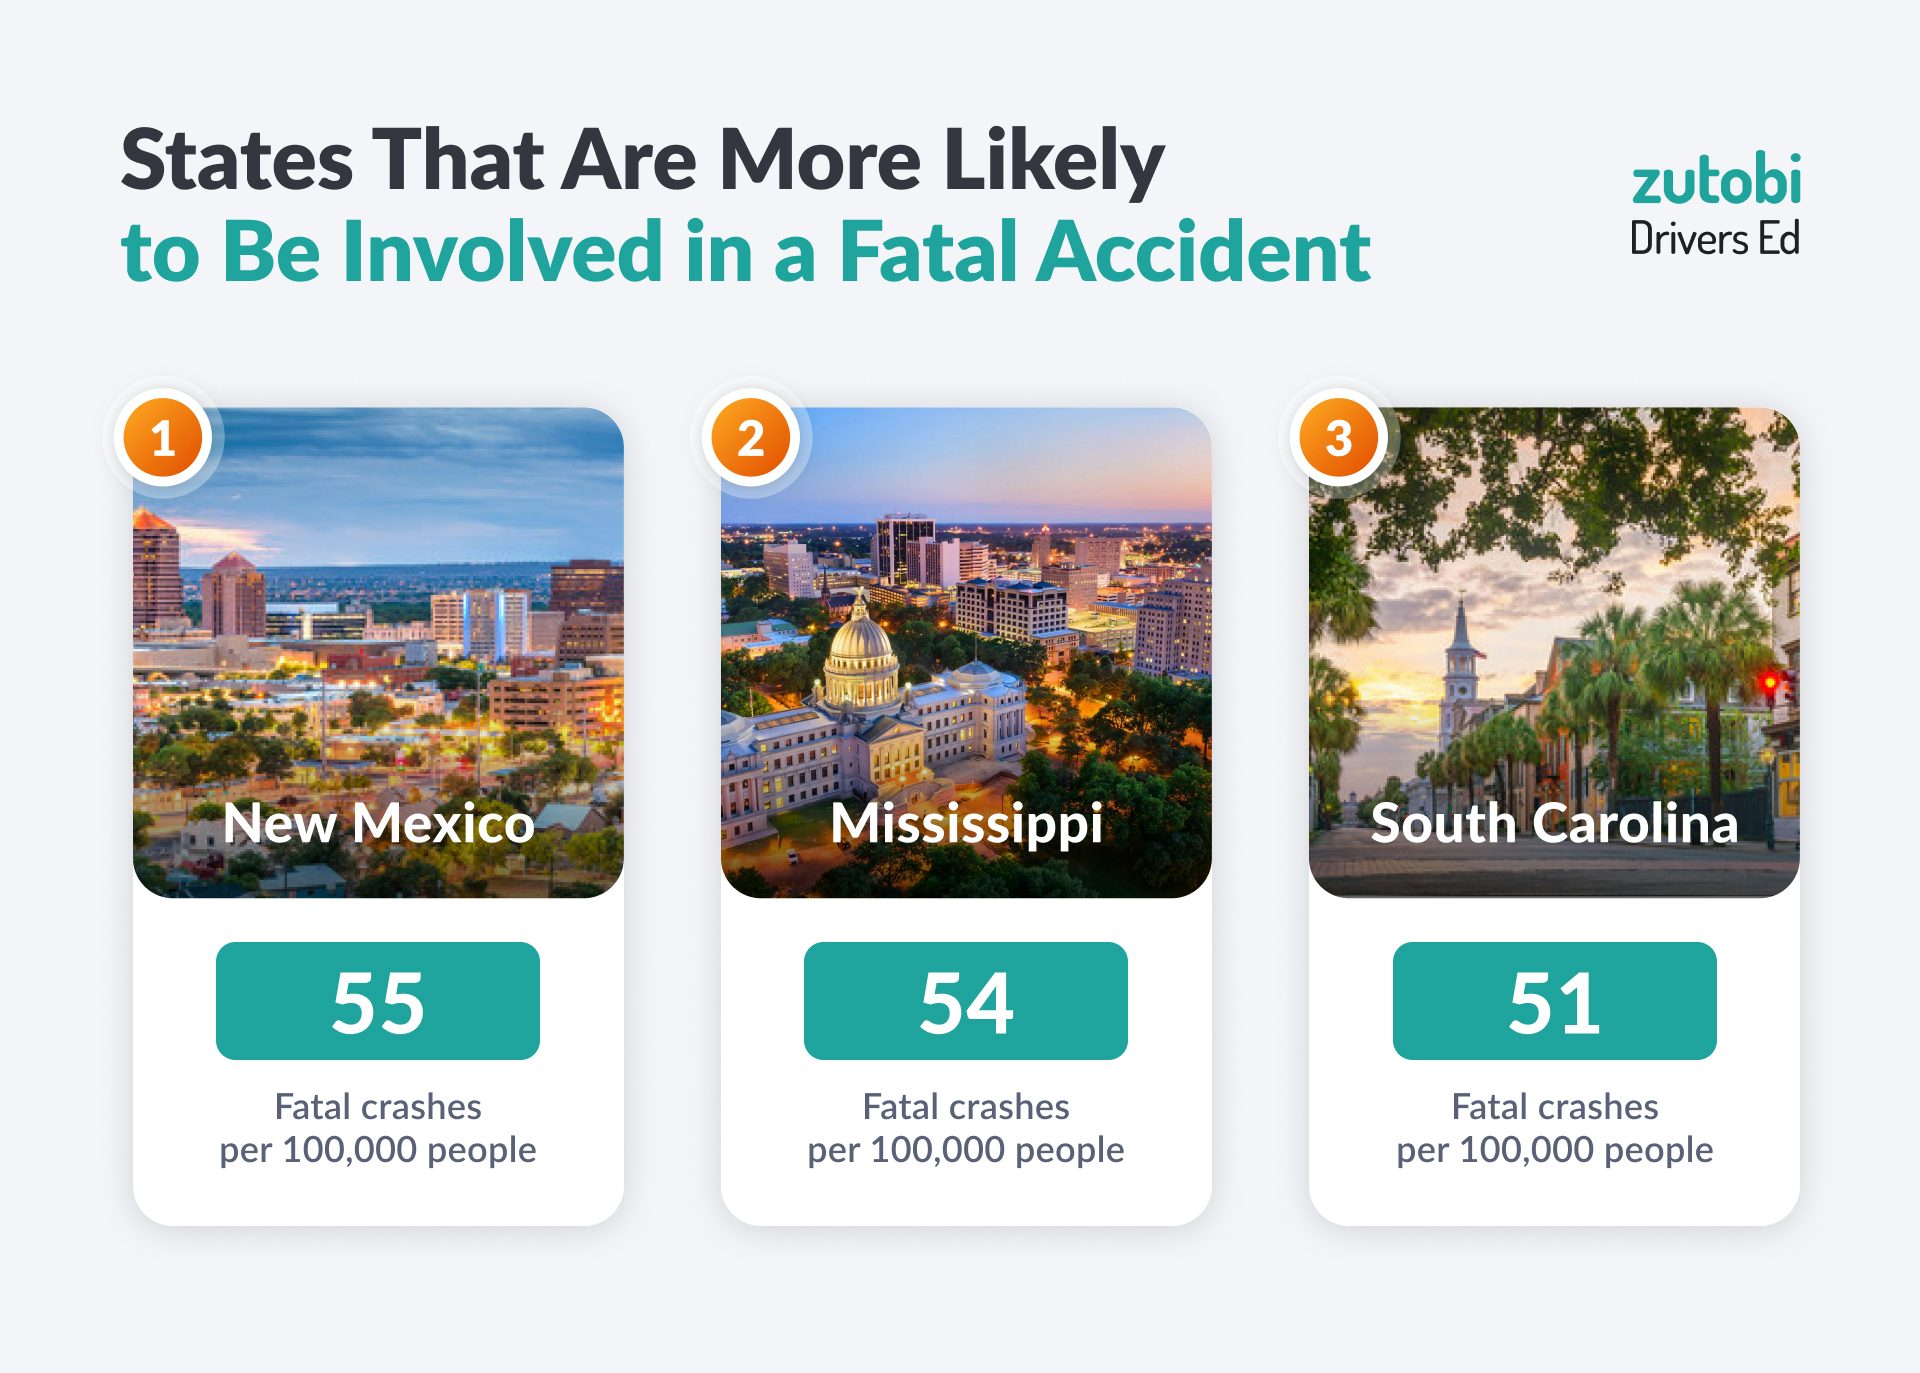
- New Mexico: With one of the nation’s highest rates of drunk-driving deaths, it’s no surprise that New Mexico is in the top one. The state has around 55 fatal crashes per 100,000 people and this number has increased compared to the previous year.
- Mississippi‘s challenge with dangerous drivers persists, as the latest data indicates that 1,589 people were involved in fatal accidents, resulting in approximately 54 fatal crashes per 100,000 people. This represents an increase from the previously reported data of 1,355 people and approximately 45.7 fatal crashes per 100,000 people. The shift reflects an increase of approximately 16.9% in the rate of fatal crashes per 100,000 people, highlighting a concerning trend in road safety in the state.
- South Carolina has seen a shift in its ranking this year, moving from the 4th to the 3rd position in the antirating. The state now ranks among the top three with 2.666 persons involved in fatal crashes, equating to approximately 51 fatal crashes per 100,000 people. This marks an increase compared to the previous year when there were 2.216 persons involved in fatal crashes, resulting in 42 fatal crashes per 100,000 people. This change represents an increase in the rate of fatal crashes by approximately 21.2%.
How can this be improved?
There are lots of ways to create safer roads. If you are a young driver, you should prepare for group pressure in case your driving with friends, as well as stay well within the speed limit.
If you’ve been driving for a couple of years, you should start thinking about refreshing the rules of the road regularly. Unlike what many drivers think, we forget important safety practices fast, and re-reading the handbook will help you keep these important safety practices top of mind. Also, speeding and cell phone use both play a huge role in creating more dangerous roads in the US, but they are also highly preventable.
Drivers need to drop the phone, slow down, and prioritize safety before convenience if we want to have safer roads.
Methodology
All data is the latest and sourced from the National Highway Traffic Safety Administration (NHTSA)’s Fatality and Injury Reporting System Tool (FIRST) and relates to crashes in 2020.
When looking at the number of crashes by gender and age, figures refer to all motor vehicle crashes that occurred, however when breaking things down by state, data was only available for those crashes which resulted in a fatality.

Take our full course with tests and theory
600+ exam-like questions and practice tests
Easy summarized DMV handbook
America’s #1 driver’s ed app with a 95.8% pass rate
Recommended articles


Ace your DMV test, guaranteed
Want to Be the Top School in Your Area?
- Simple & automated admin
- More time for teaching
- #1 learning materials for students
Start learning now
Resources
- Driver’s License Renewal
- How to Get Your US Driver’s License
- How to Prepare for Your Road Test
- How to Get a Driver’s Permit
- Behind-The-Wheel training
- Courses
- Blog
- FAQ
Show More
©2026 Zutobi AB, 4 Peddlers Row, Unit #103, Newark, DE 19702