
Motoring Projections
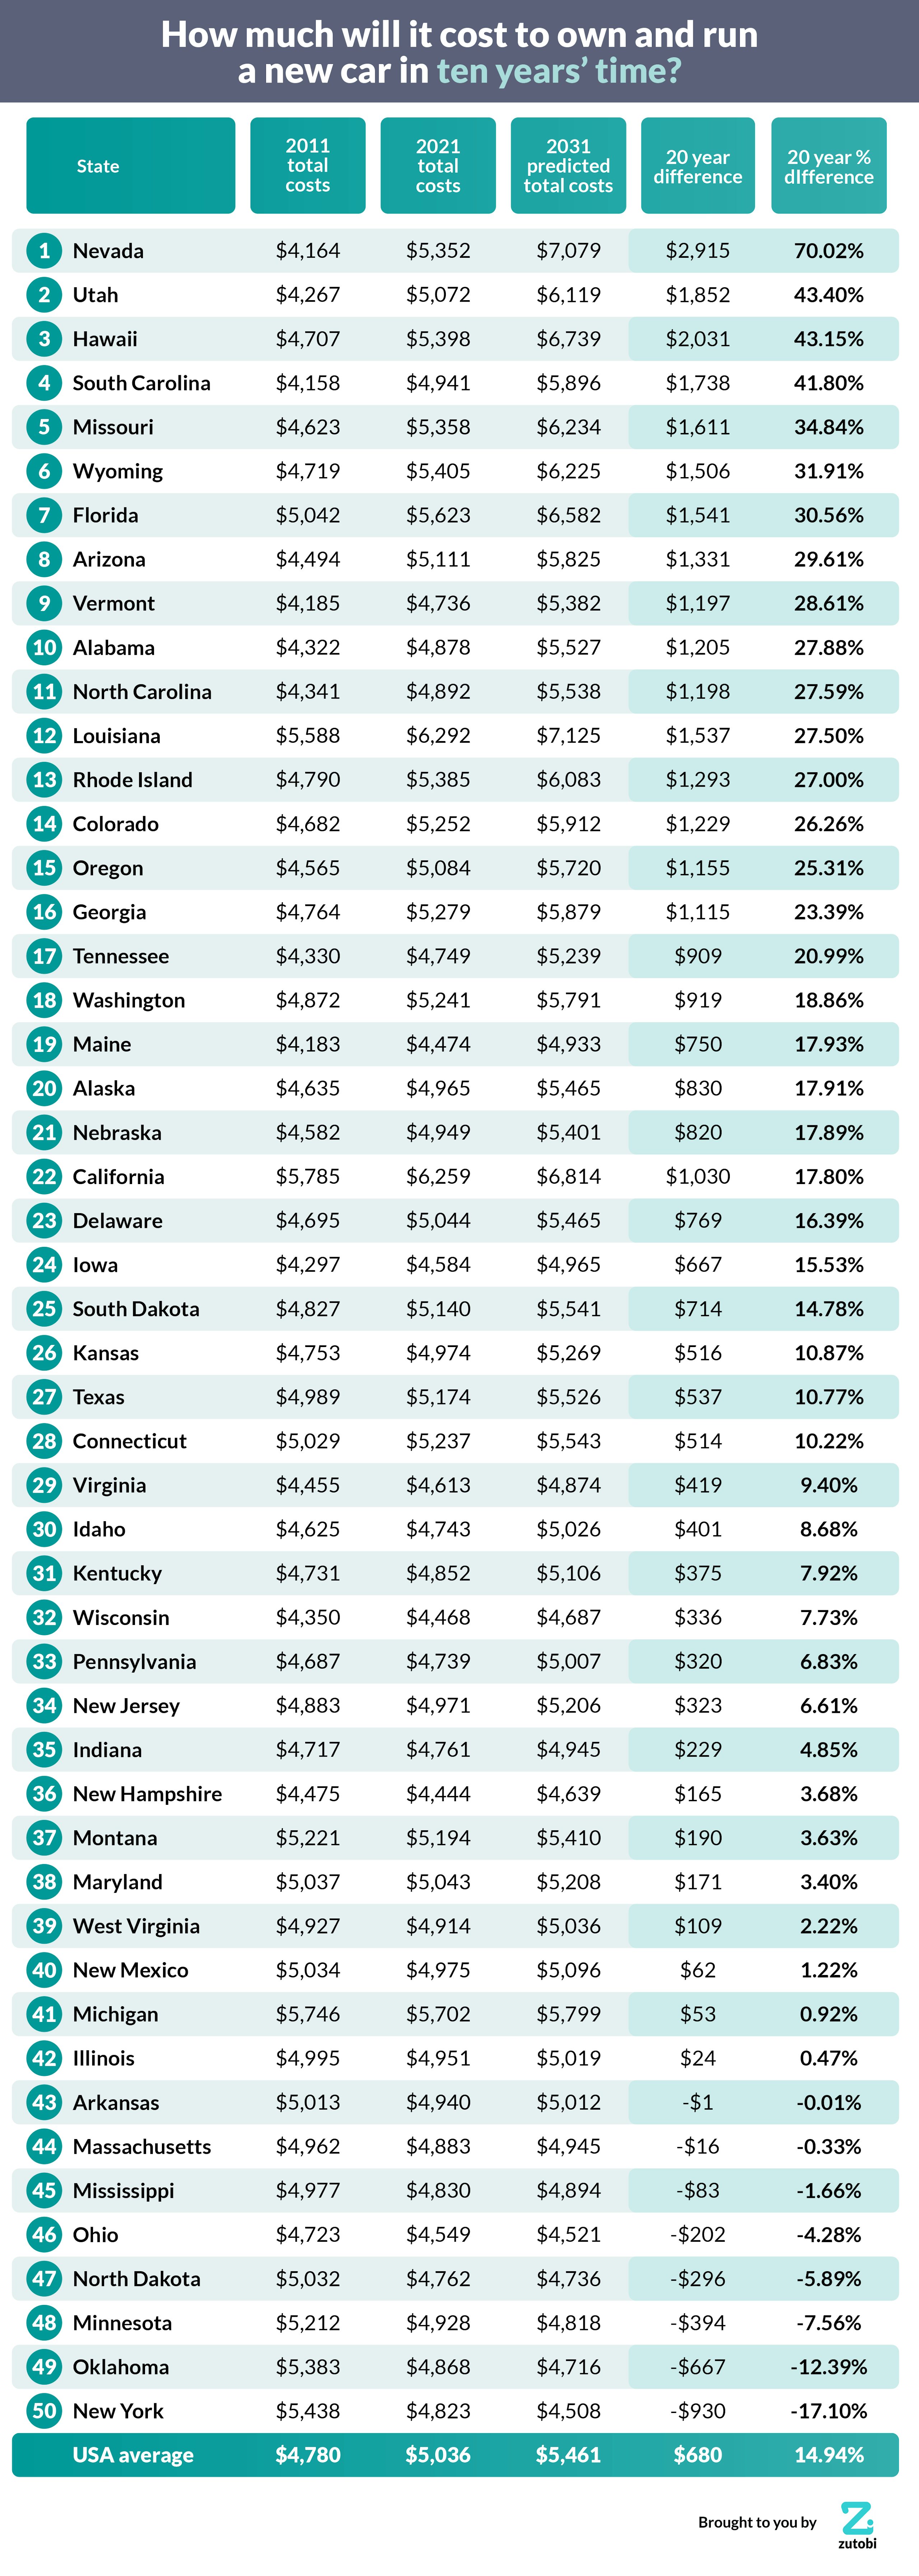
How much will it cost to own and run a new car in ten years’ time?
Predicting the future is never an exact science as anything could happen that we just can’t see coming, therefore we instead have to make educated guesses at how the future will look.
By taking into account the rising costs of owning and running a car in the United States, we have estimated the cost in ten years’ time. Furthermore, we have broken down the data by each individual state to see where the most expensive and cheapest places in the country will be to own and run a car.
Factors analyzed to determine owning and running a car:
- Average annual depreciation of the vehicle.
- Average annual fuel costs.
- Average annual insurance costs.
To create a fair system we decided to base the data on America’s most popular car, the Ford F150 pickup truck. The base model of this car across the States costs $26,615 which is $4,415 more than the $22,000 it cost in 2011.
The annual average mileage is 14,500 miles, and the F150 achieves an average 25 MPG, therefore you need to buy on average 580 gallons of fuel to run it for a year. Insurance costs per state were the third factor used to project the cost in each state.
The Rising Cost of Owning and Running a Car in the United States
To discover how the cost of car ownership has changed across the entire United States in the past ten years and how we predict it will change in the future, we have taken the costs in every state to discover a national average in depreciation, fuel and insurance costs.
Rising Cost of the Ford F150
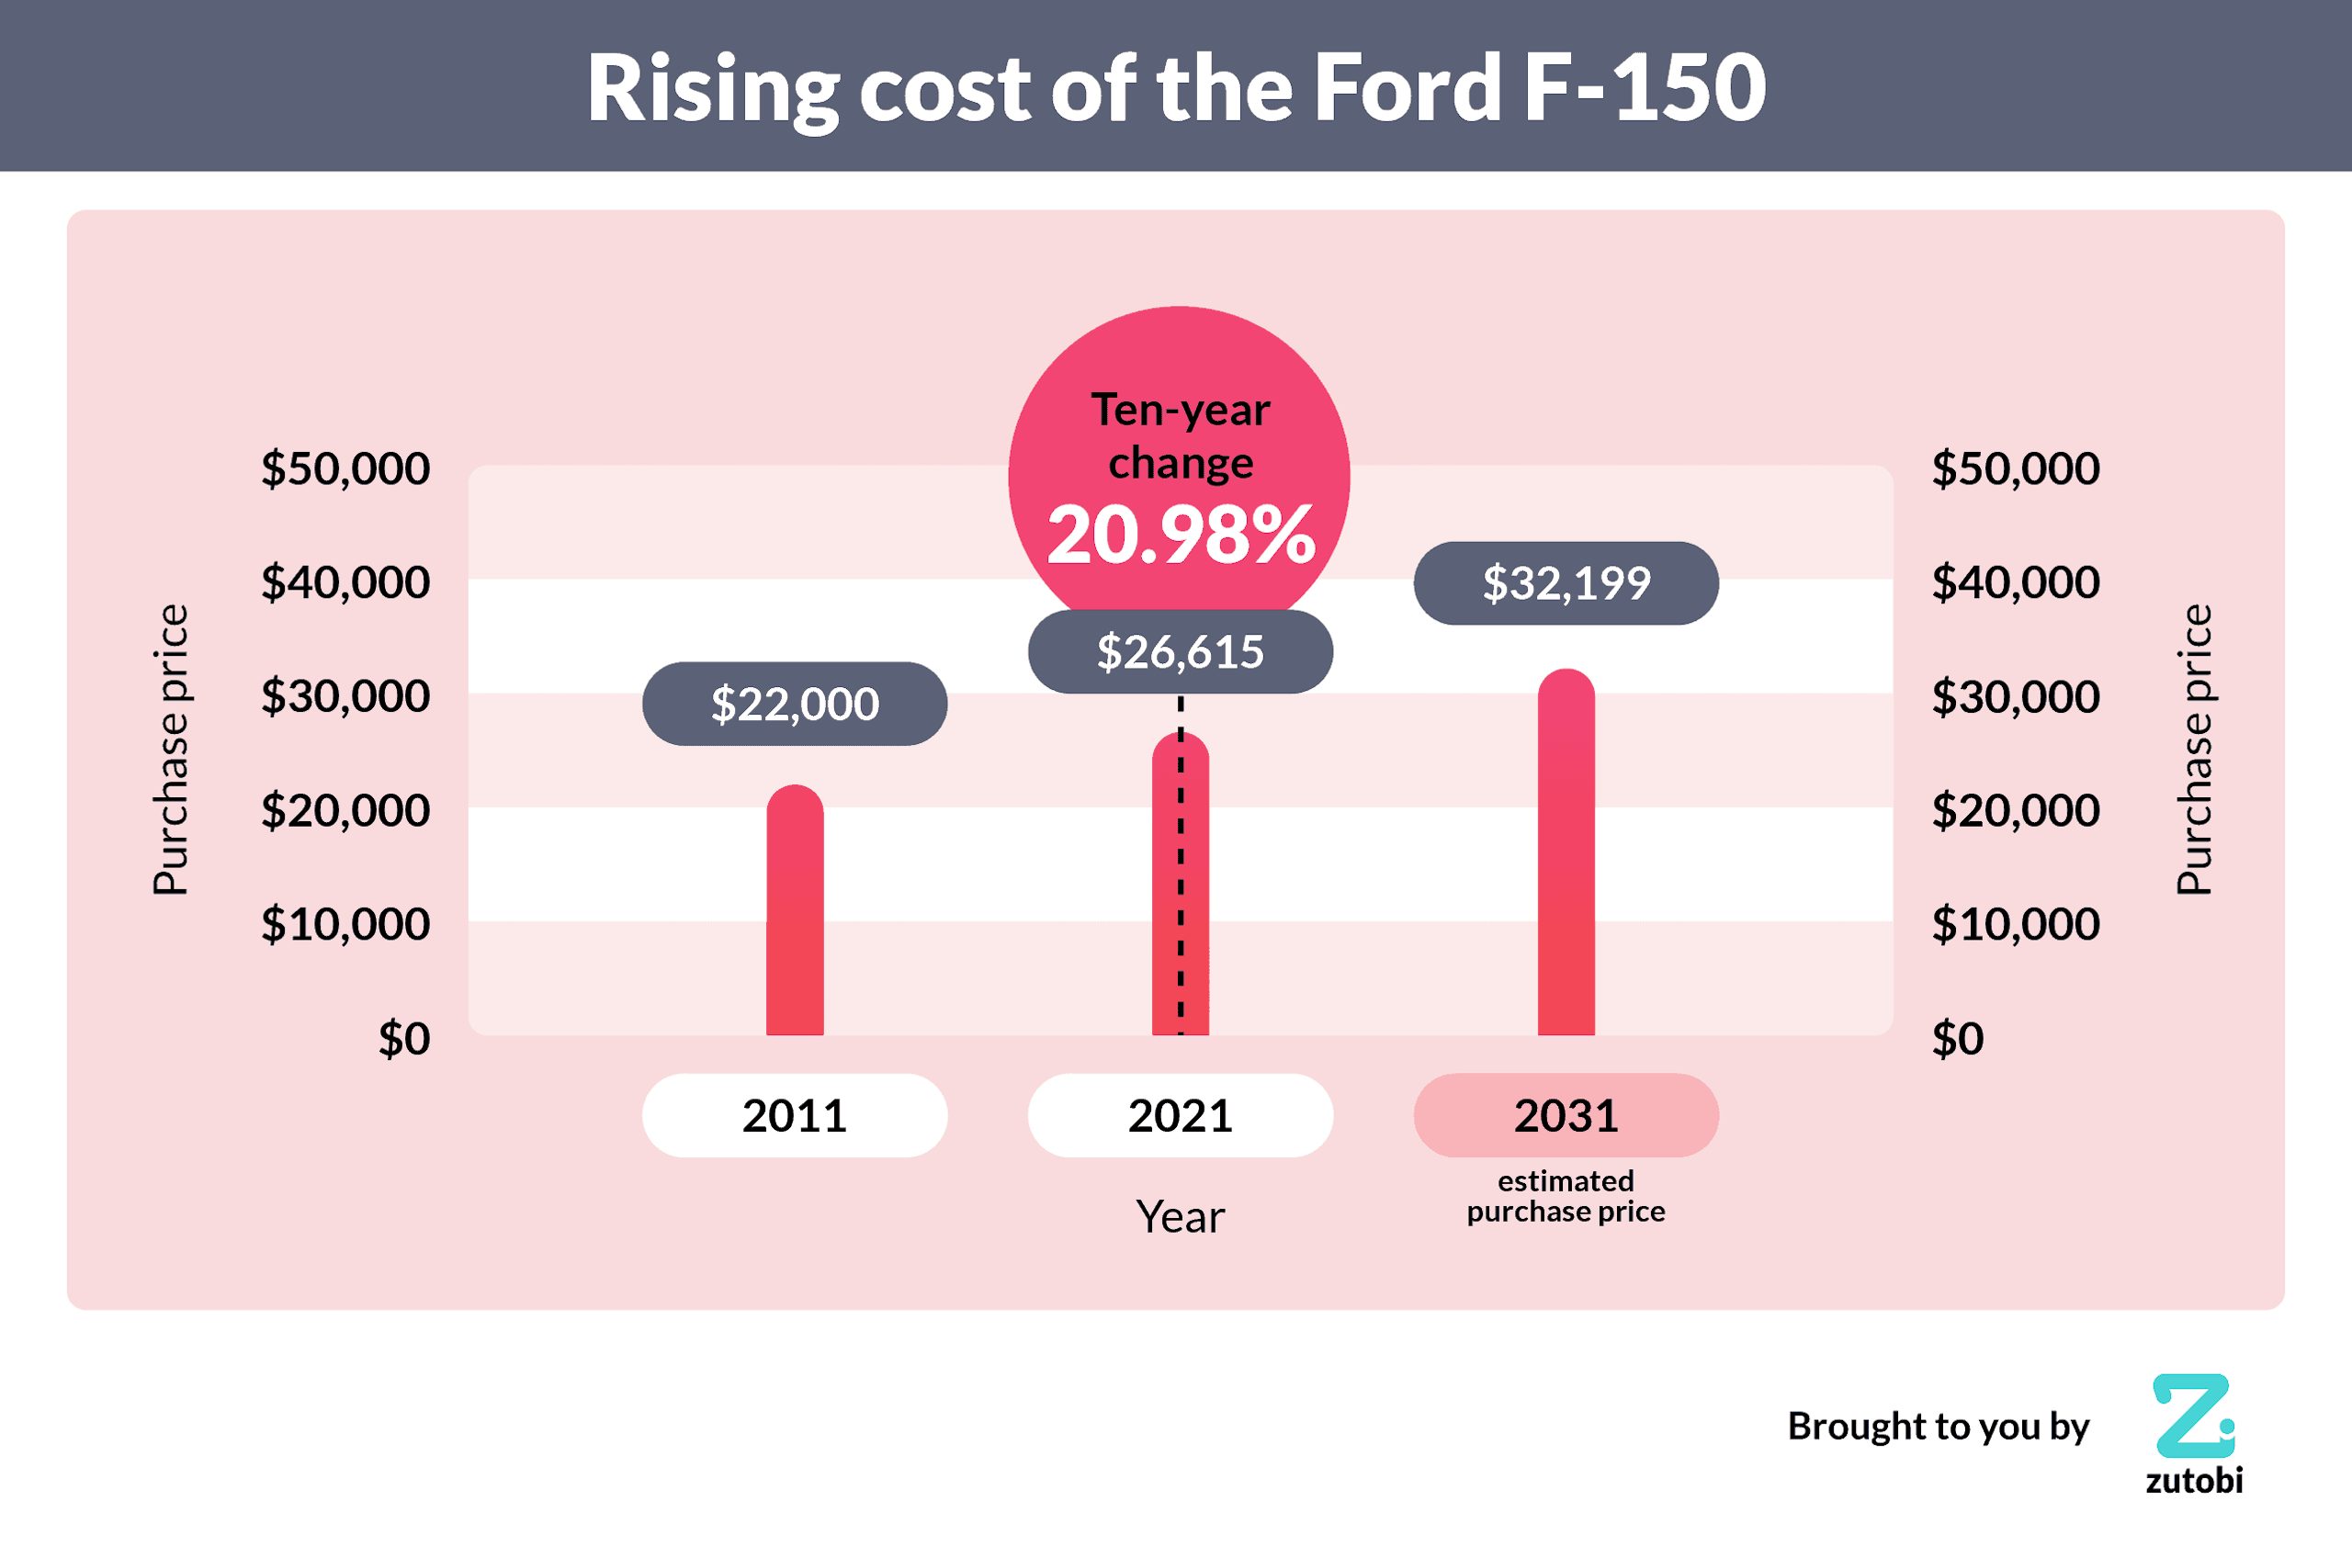
The best-selling car in the USA consistently over the past decades has been the Ford F-150 pickup truck, when it was introduced in 1948 it only cost $1,279. Since then it has become bigger and better, and in 2011 the twelfth generation of the vehicle cost $22,000 dollars when new. Today the price is $26,615, which shows a 20.98% price increase in the past decade. We therefore apply this to the cost going forward and we estimate that the cost will rise to $32,199 in 2031.
Change in Ownership Costs
Fuel
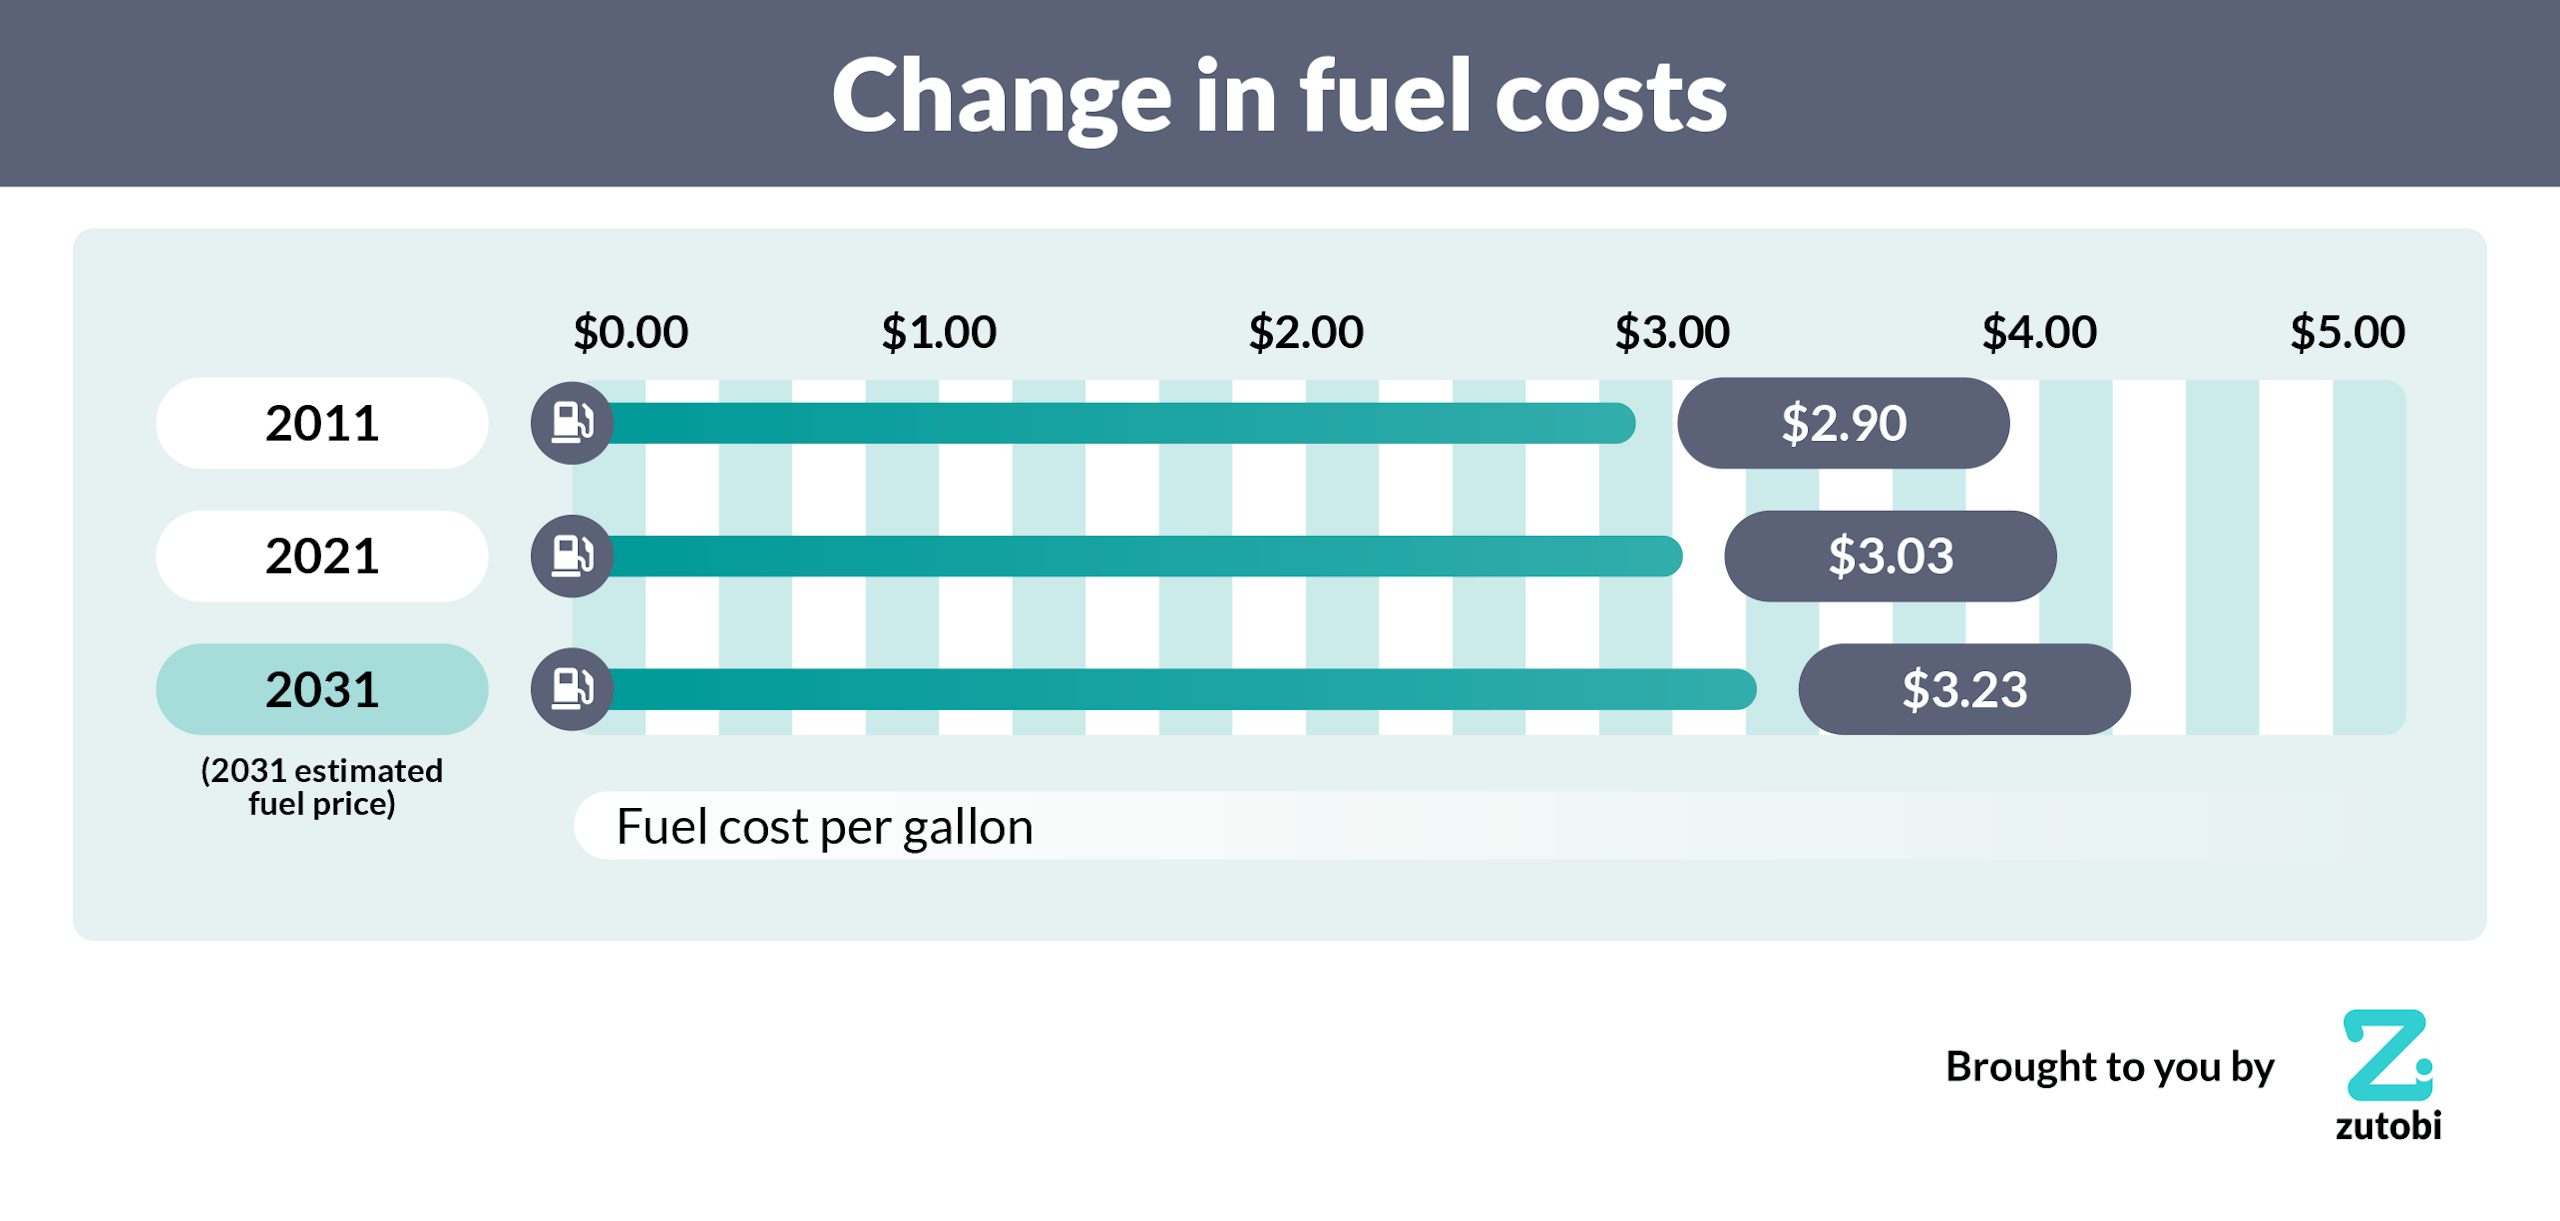
Prior to the oil crisis of the 1970s petrol prices in the USA remained stable at 30-40 cents per gallon on average across the country, this is a massive difference compared to the average of $3.03 today.
In 2011 the nationwide fuel price average was $2.90 meaning that in a decade prices had only risen by 13 cents per gallon, this equates to a 4.51% increase in costs. When applying this to our future projections we estimated that fuel costs will only rise to $3.23 per gallon in 2031 providing prices continue to rise at their current rate.
Insurance
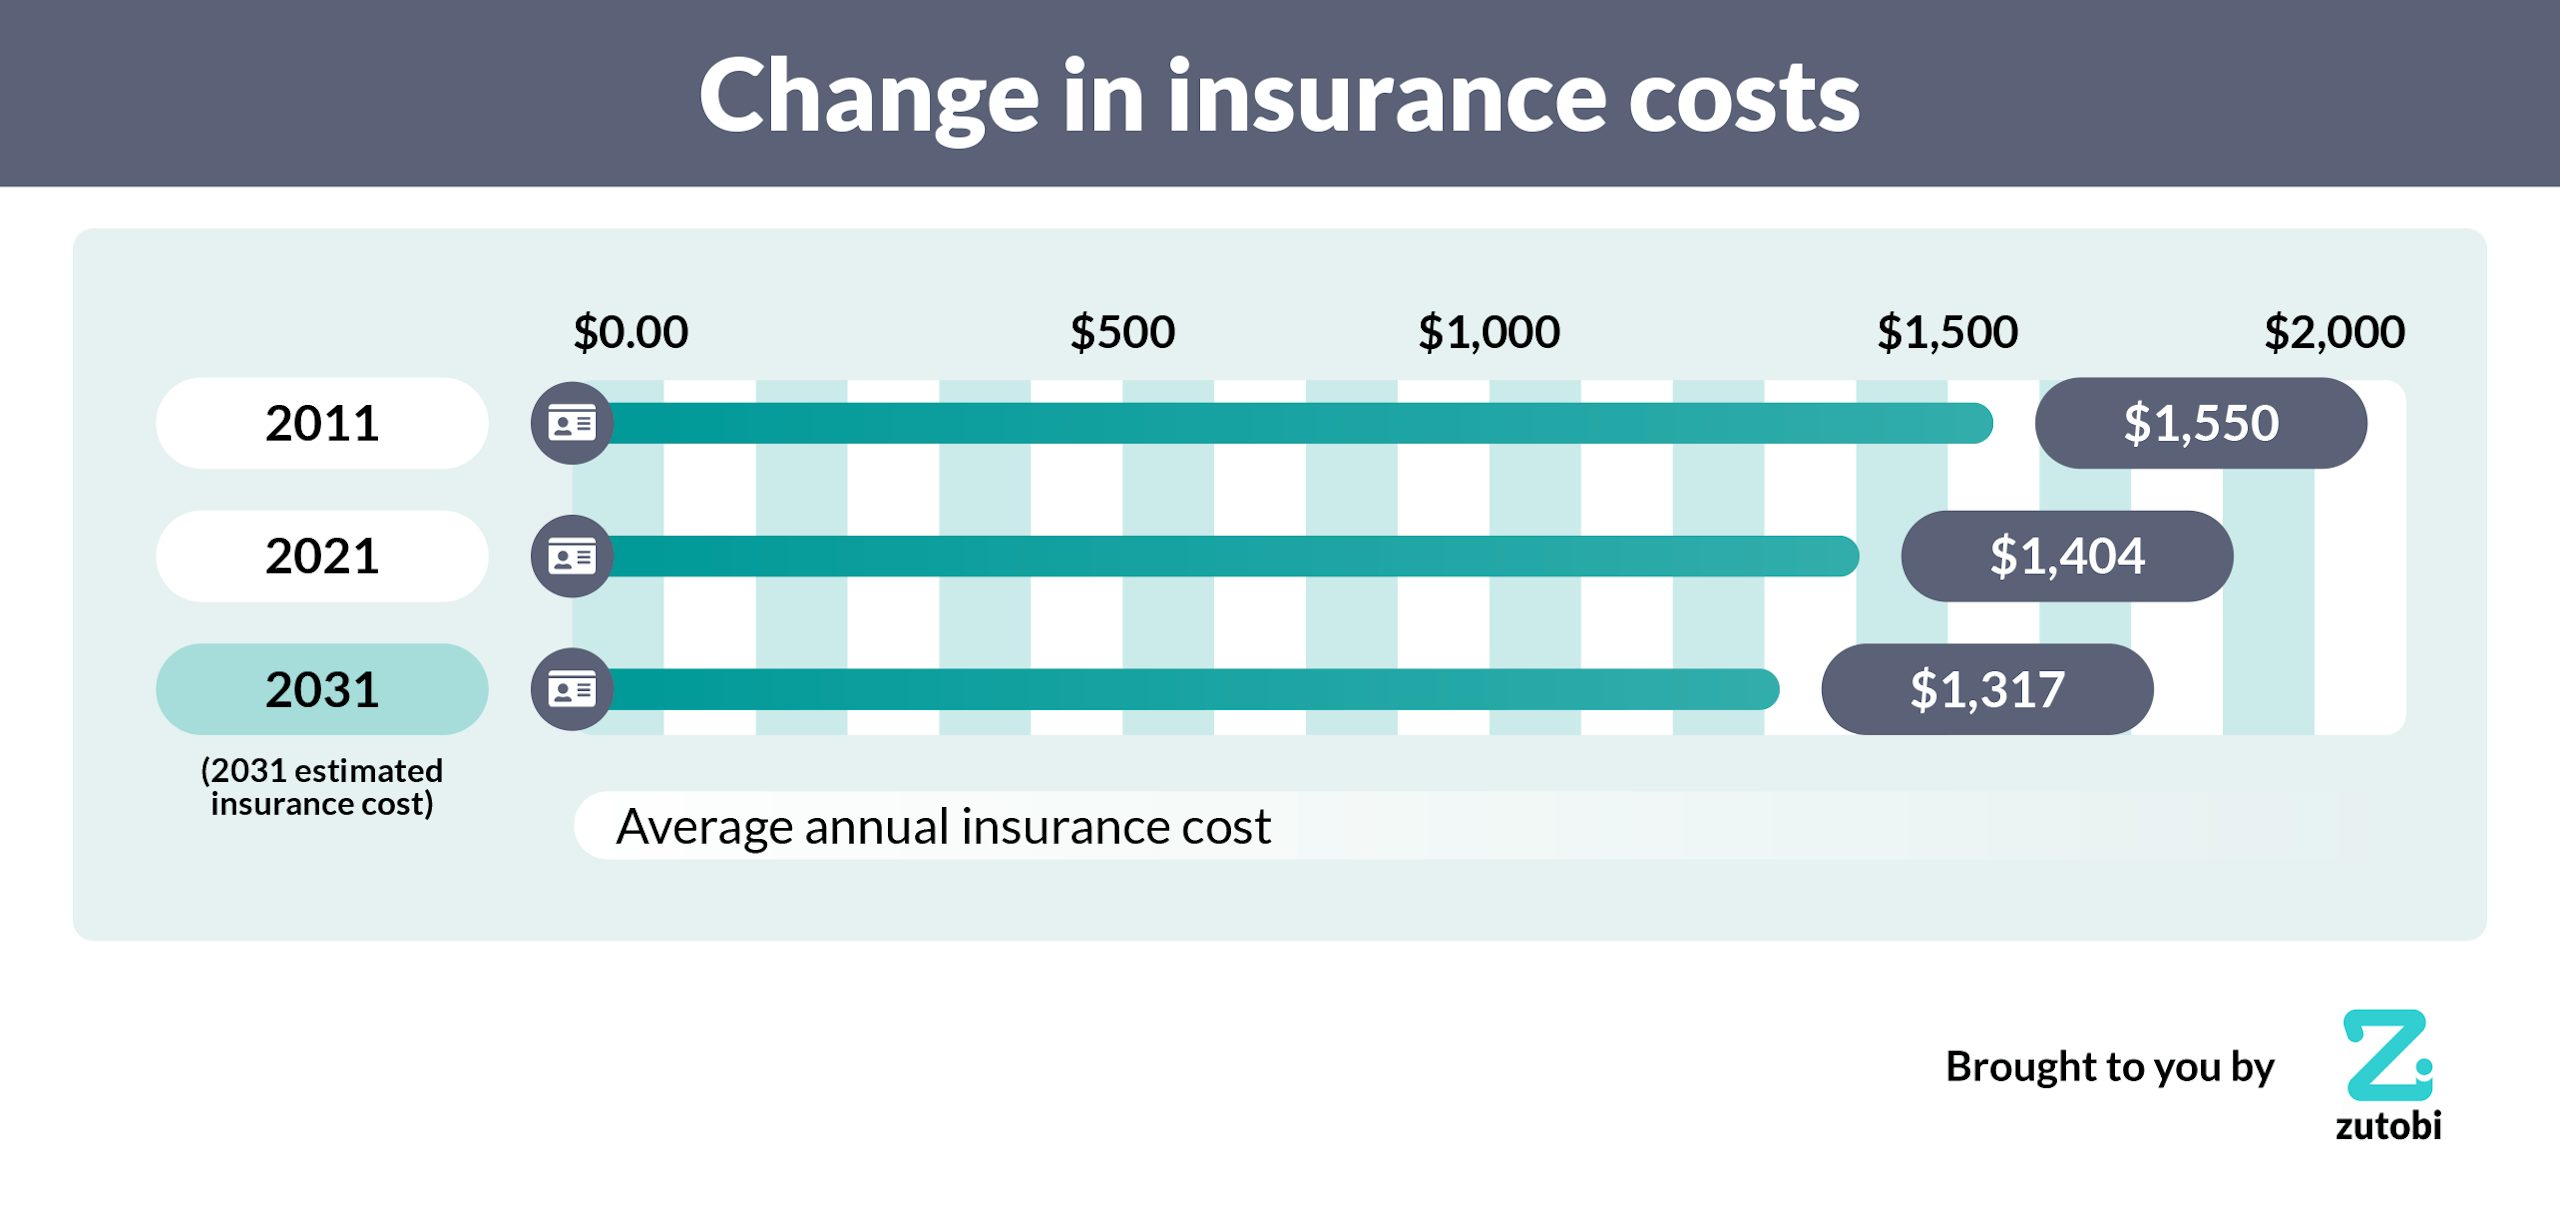
Whilst fuel prices are on the rise across the country, average insurance premiums are actually reducing in the United States. The average cost of insurance in 2011 was $1,550 per annum, which is $145 more than the average cost today of $1,404, when applying this to the future predictions we discover that there is a 9.4% decrease which would result in estimated costs of $1,317 in ten years time.
Vehicle Depreciation
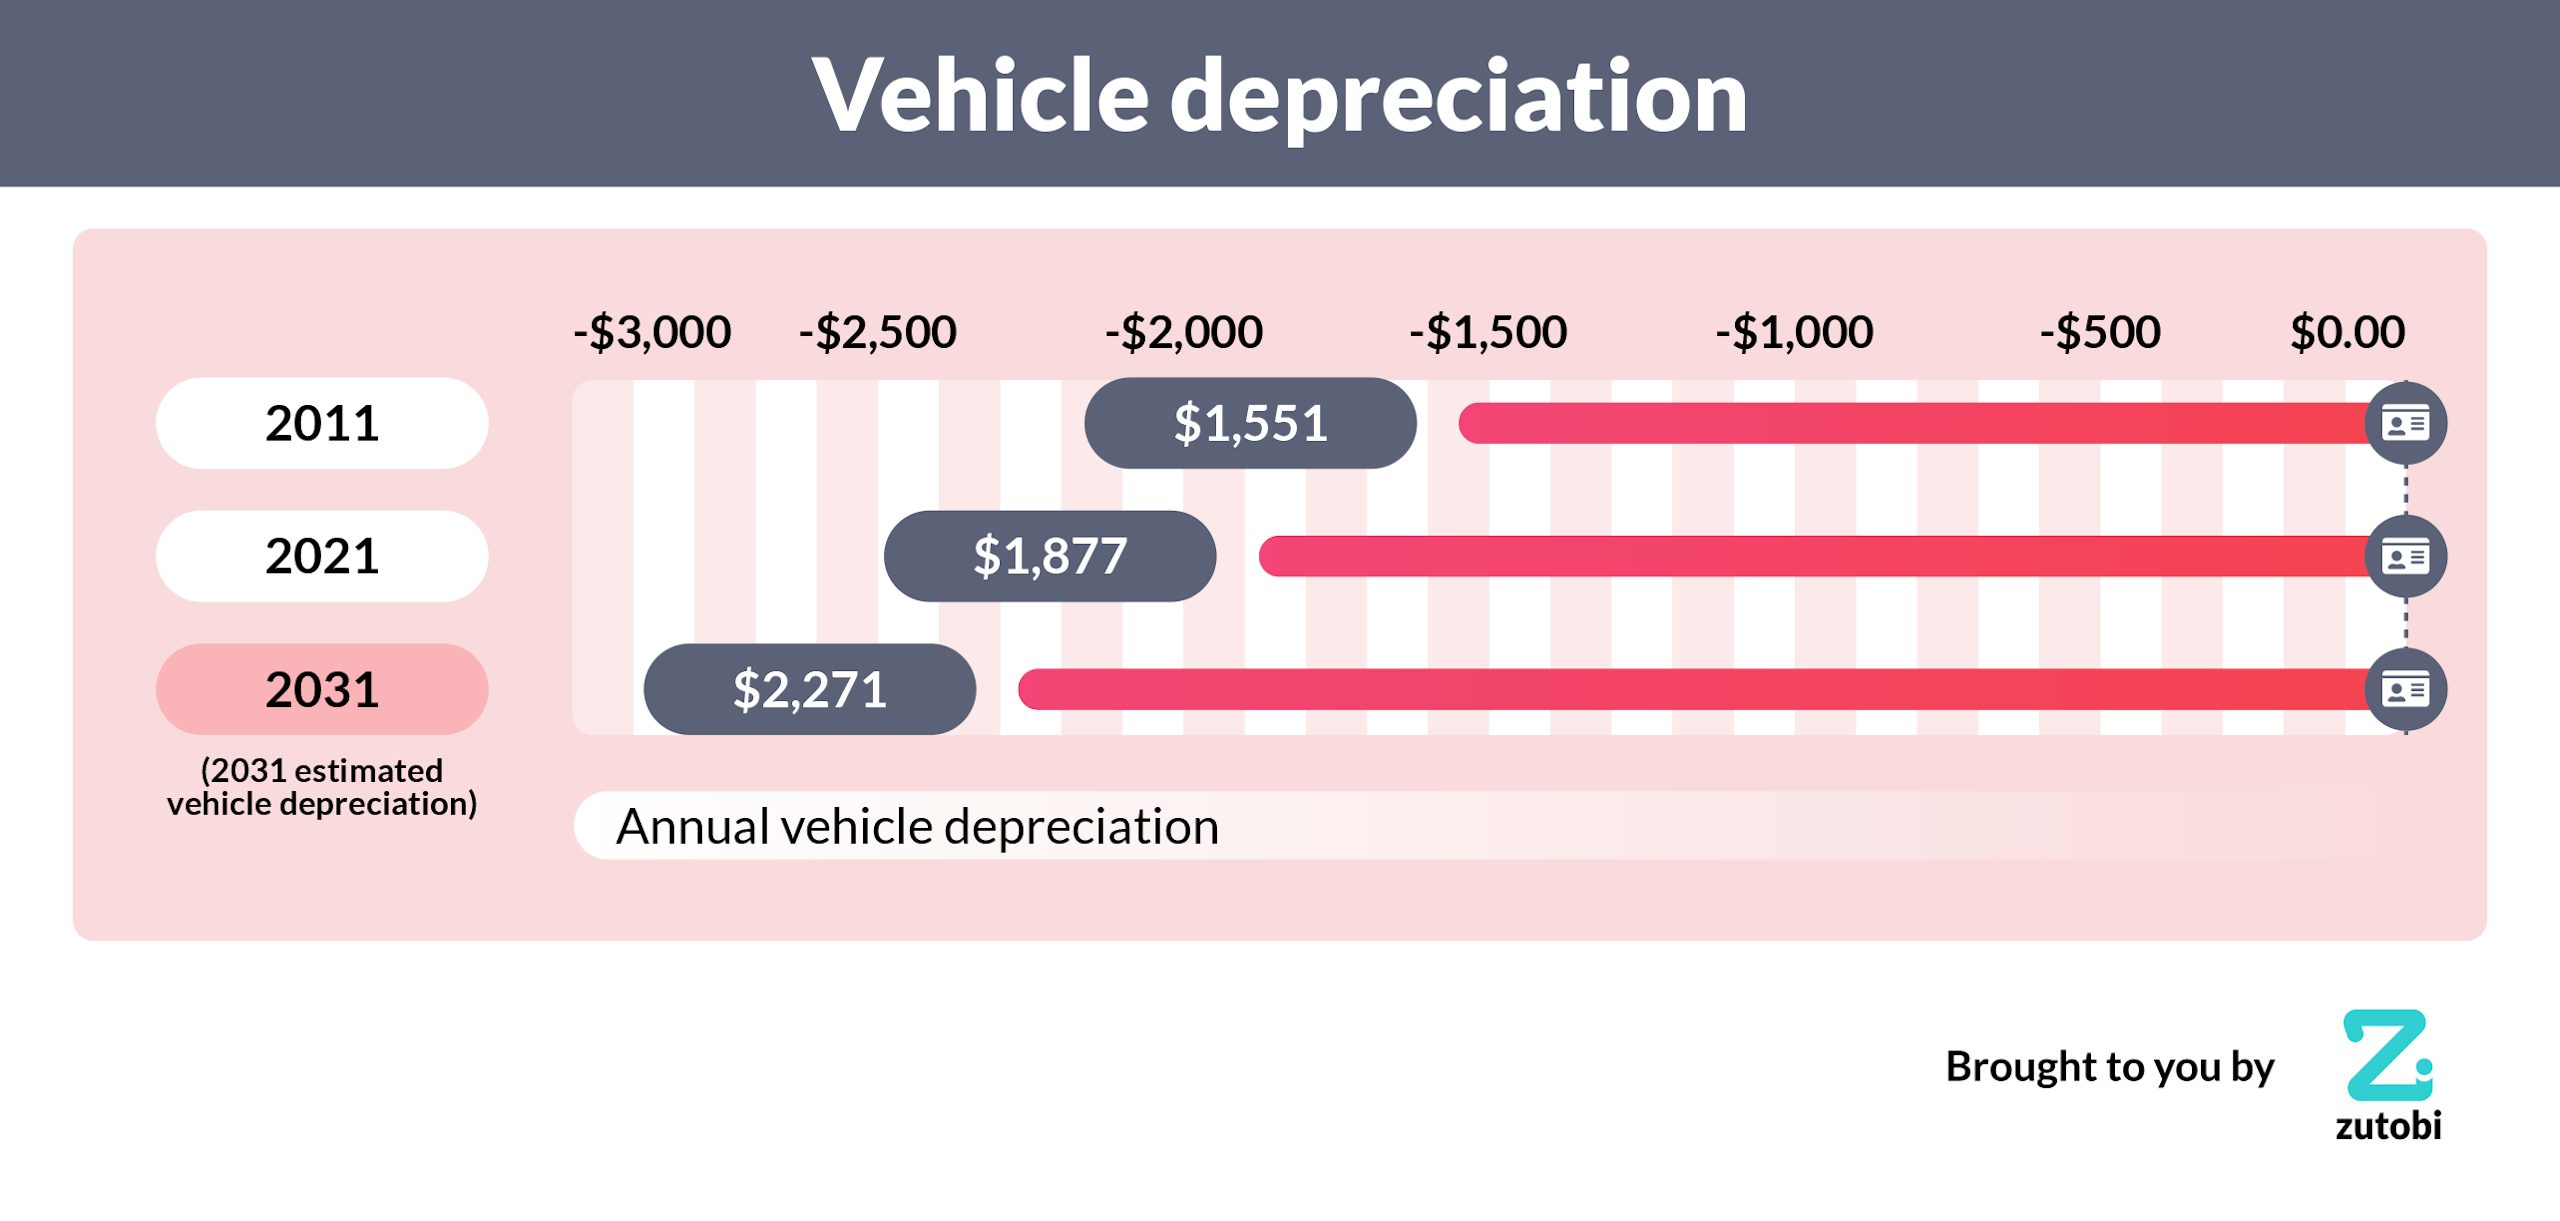
In 2011 the ford F150 would depreciate by $1,551 on average in every year owned, meaning that if you owned it for the average length of 6 years the car would be valued at $12,692. Comparatively when buying the F150 today, it would depreciate by $1,877 per year and be worth $15,354 in the same time.
Consequently, it is estimated that when buying an F150 in 2031 for $32,199 it is estimated that it will depreciate by an average of $2,271 every year. After six years of ownership the car would be worth an average of $18,575.
The most expensive states to own and run a car for a year in 2031
Back in 2011 California was the most expensive state to own and run a car, with annual costs of $5,785. However, since then, they have dropped to the second most expensive today, and by 2031 they will only be the third most expensive.
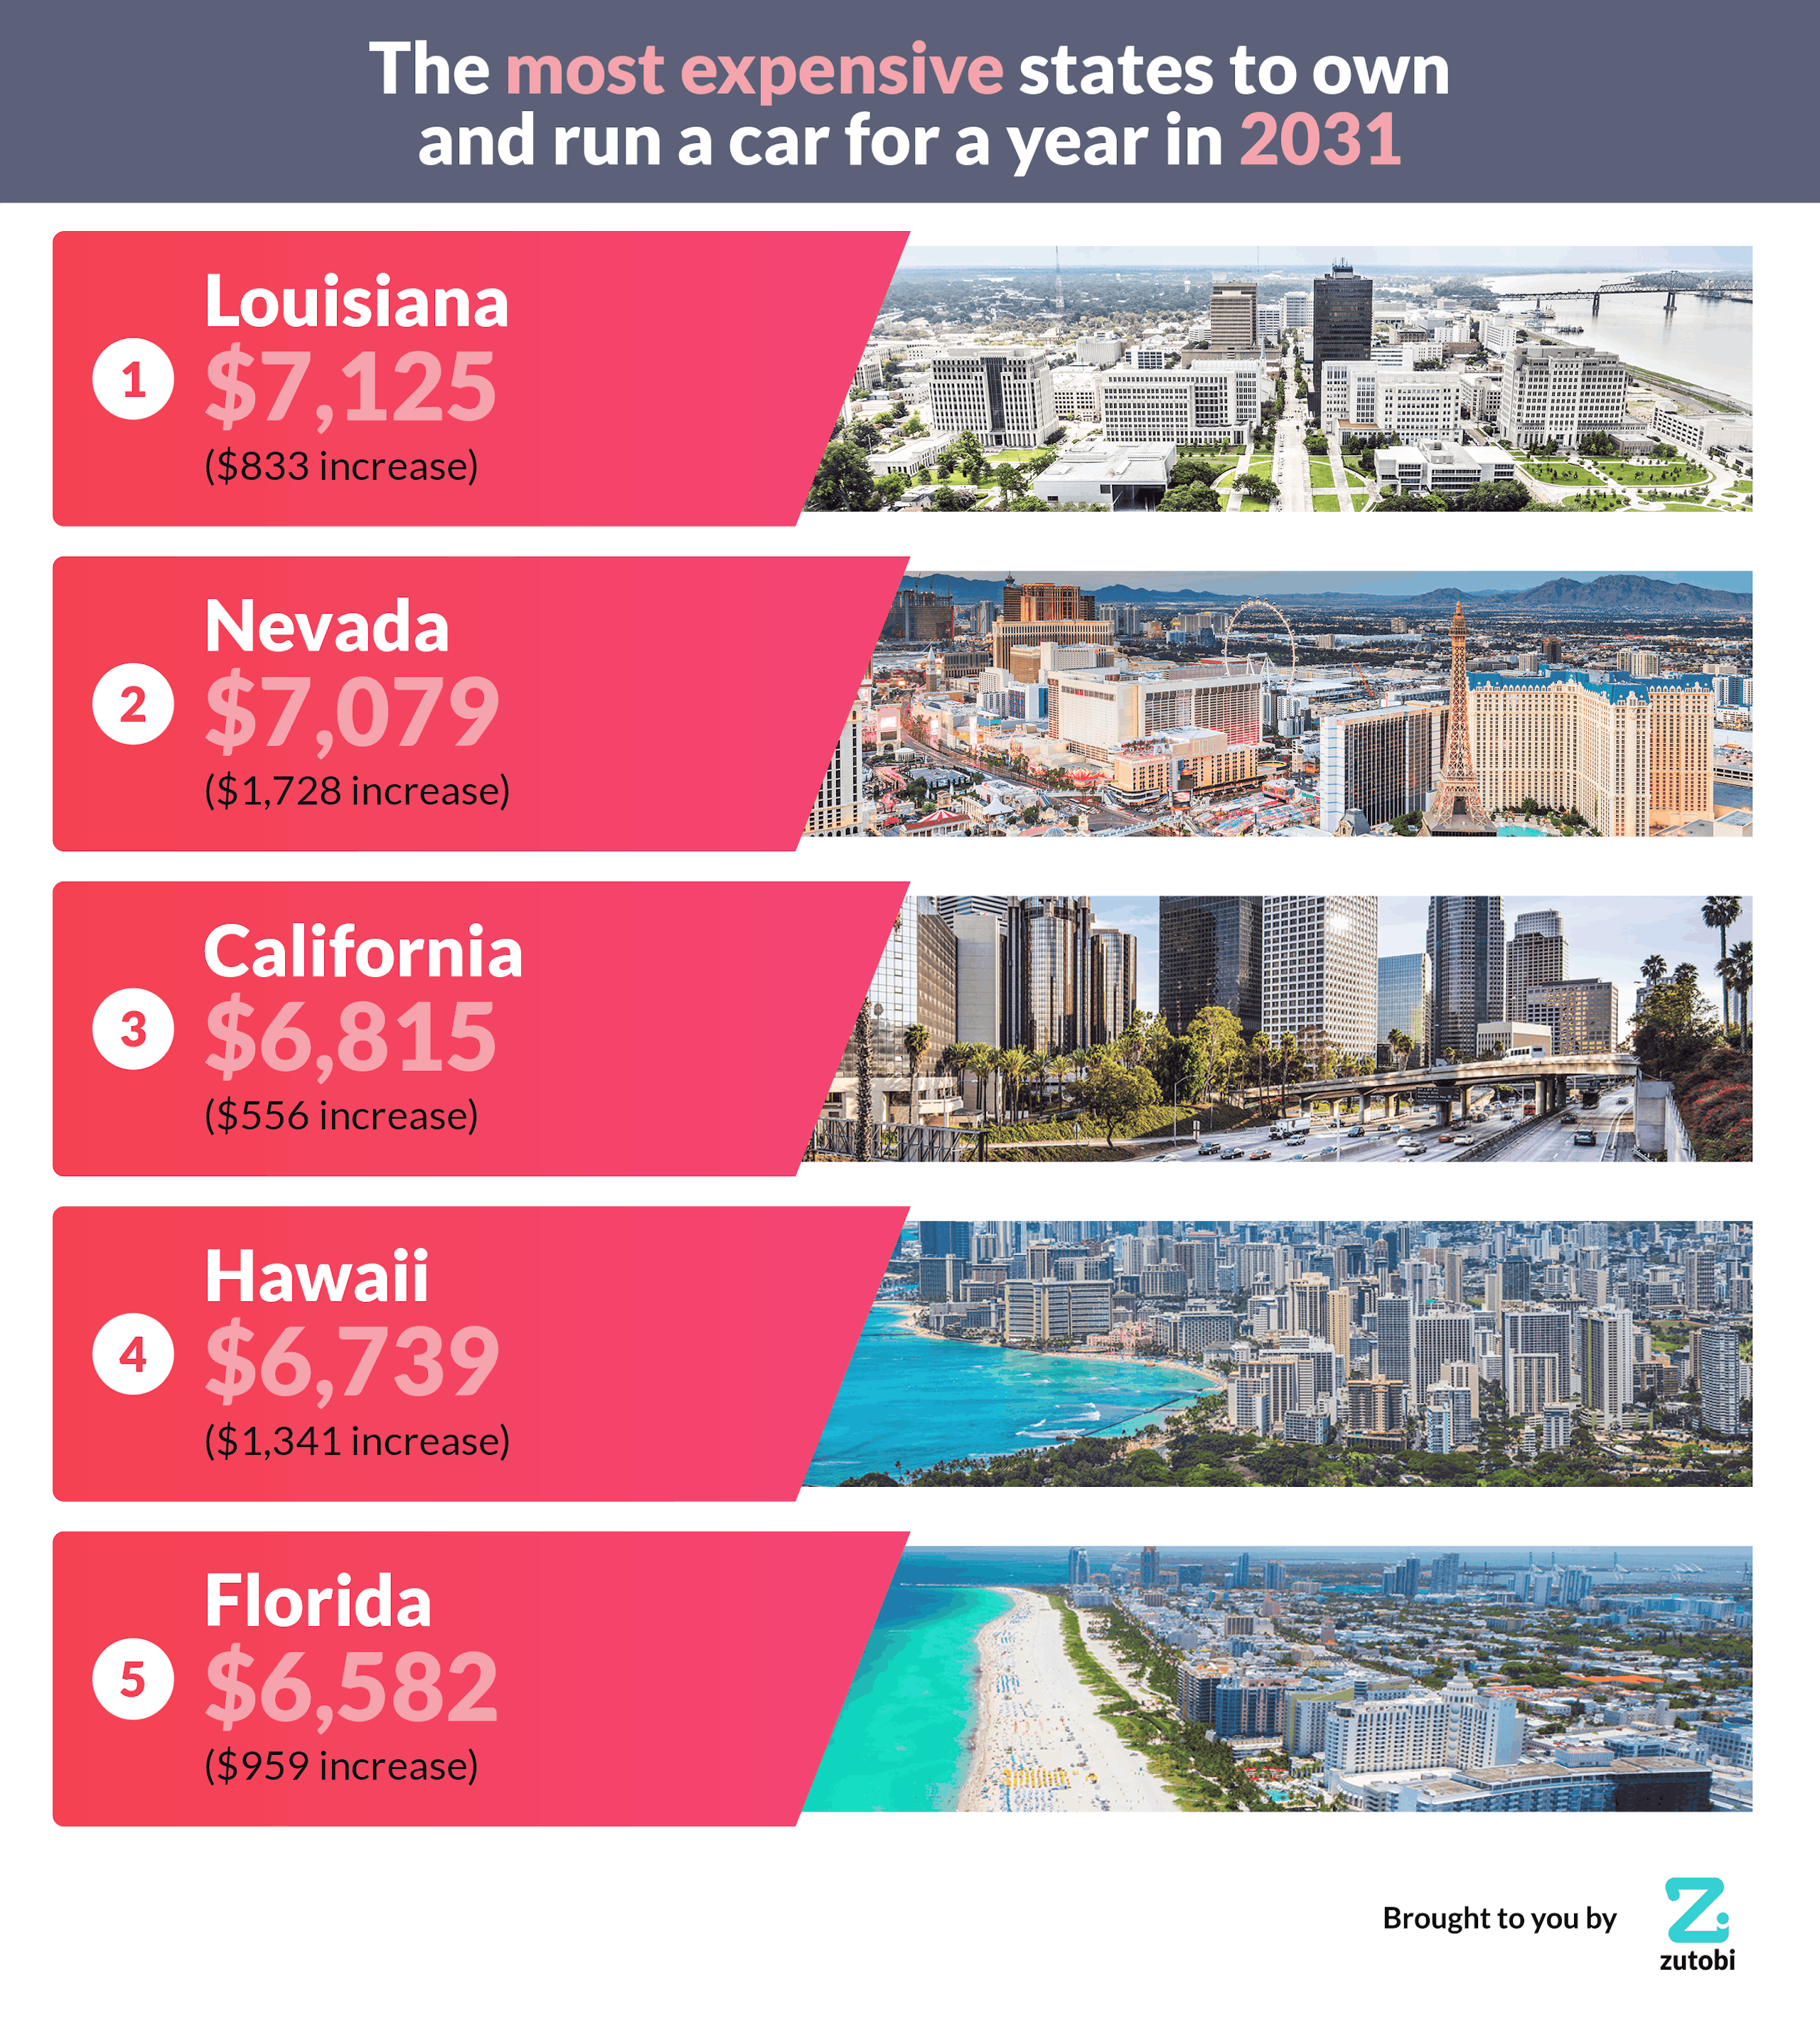
1 – Louisiana: $7,125 ($833 increase)
The state that will have usurped California and will be the most expensive place to own and run a car in 2031 will be the Southern coastal state of Louisiana. It will cost just over $7,000 which is over a $800 increase from the current costs of $6,292, Louisiana will also have the current highest average insurance rates, $3,286 in 2031.
2 – Nevada: $7,079 ($1,728 increase)
Nevada is the state where the cost of owning and running a car for six years is increasing at the fastest rate, consequently, we estimate that the average cost will rise by over $1,700 in the state over the next decade. This estimated increase is largely due to the rapid rise in fuel prices that the state has experienced in the last decade; there has been a 59.6% rise in the price per gallon since 2011, and if this continues Nevada will become very expensive. Incredibly, Nevada was the second cheapest state in 2011, whereas in 2031 it will be the second most expensive.
3 – California $6,815 ($556 increase)
Today in 2021 California is the second most expensive state to own and run a car for six years, but in the next decade, they will have dropped to third (although costs will still increase by over $500). The golden state is only around $300 cheaper than Louisiana but the gap is increasing.
4 – Hawaii $6,739 ($1,341 increase)
The first state not on the mainland to feature in the rankings is Hawaii. By the year 2031, it will cost just over an estimated $6,700 to own and run a new F150. Like Nevada, Hawaii will see a large increase of 43% to move it from the 29th most expensive state in 2011 up to the fourth most expensive in 2031.
5 – Florida: $6,582 ($959 increase)
Florida will be the fifth most expensive state to own and run an F150 in 2031, with costs over $6,500 which is about $1,000 more than the national average is estimated to be. Fuel costs are decreasing by 17%, however, insurance is increasing at 41% (the highest anywhere in the country.
The least expensive states to own and run a car for a year in 2031
While living in some states will make it incredibly expensive to own and run a car in 2031, there are also some that are very cheap by comparison. Back in 2011, South Carolina was the cheapest state but by 2031 it will have shot all the way up to be in the top eleven most expensive.
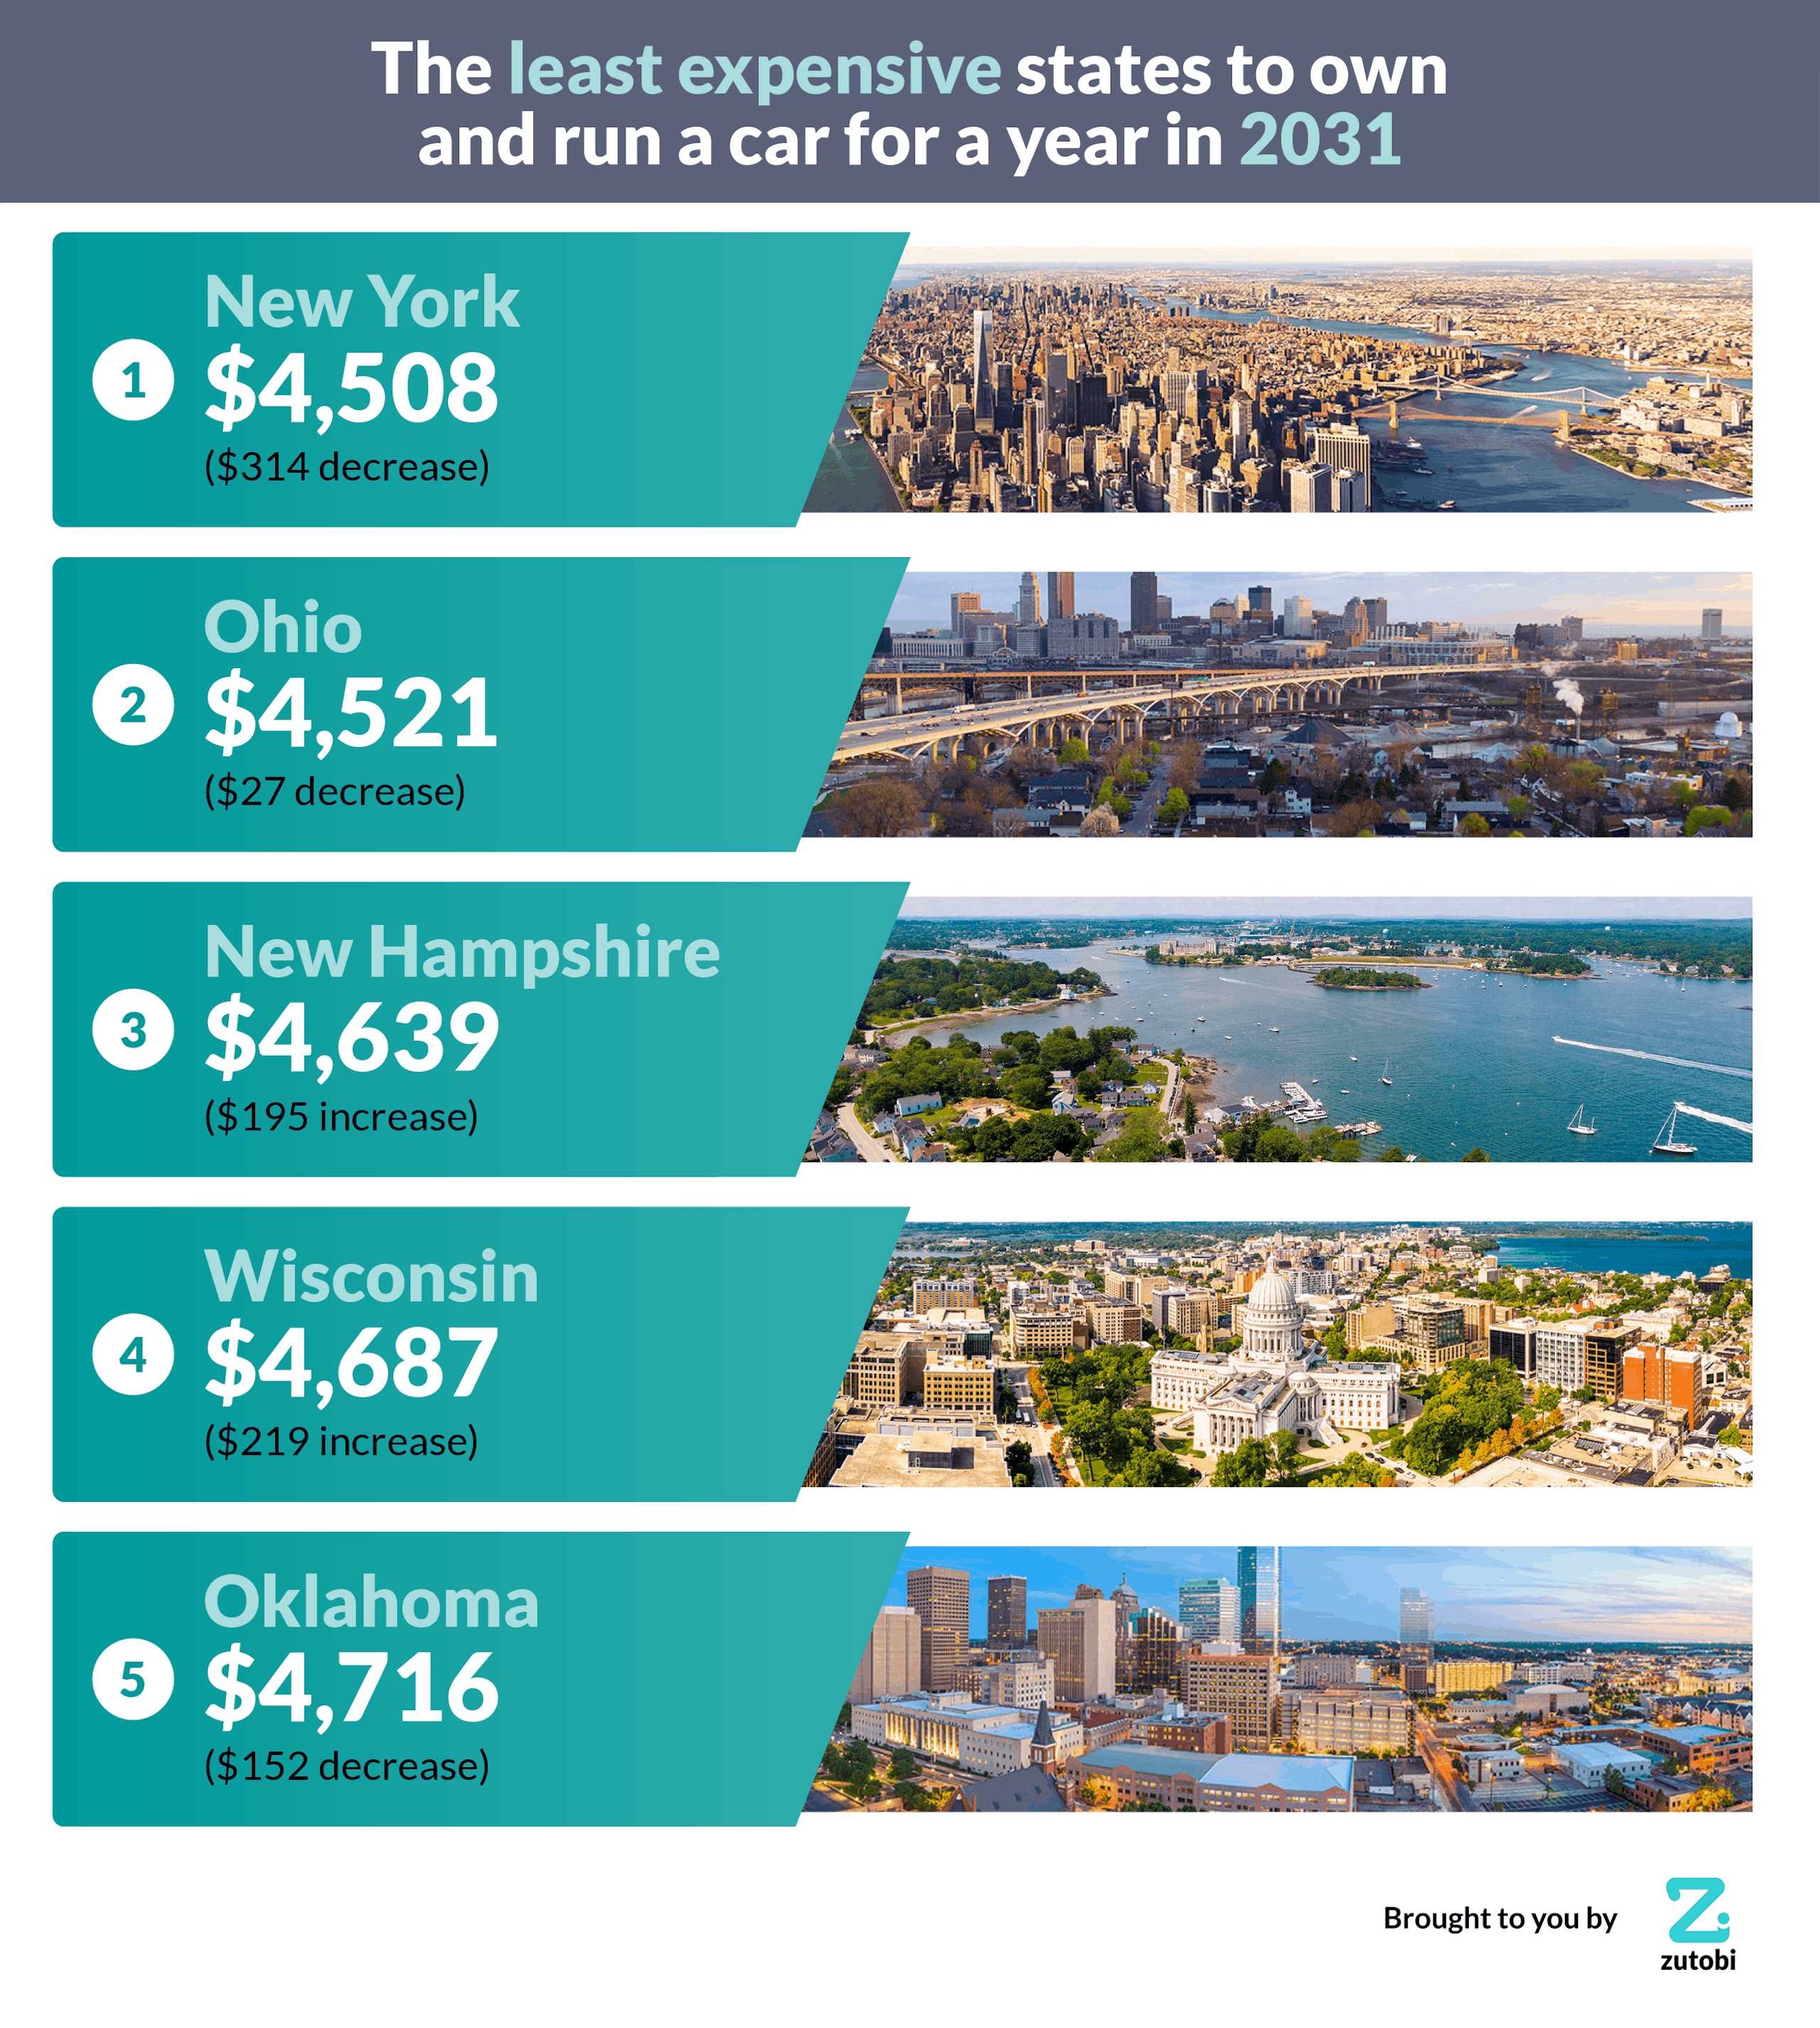
1 – New York: $4,508 ($314 decrease)
The estimated cheapest state to own and run a car on average will be New York in ten years time, the East Coast state will cost just over $4,500 dollars in 2031. In 2021 New York is only the 13th cheapest state, but low rises in insurance and fuel costs mean it will become cheaper by the start of the ’30s at this rate.
2 – Ohio: $4,521 ($27 decrease)
The second cheapest state to own and run a car on average in 2031 will be Ohio, Ohioans will only have to pay around $42,500 to own and run a car for six years. Only $13 will separate Ohio from New York so it is estimated to be a close race for the cheapest state in 2031.
3 – New Hampshire: $4,639 ($195 increase)
Although New Hampshire will be the third least expensive state to own and run a car in 2031, it will have relinquished the crown of the cheapest state which it currently owns. The 5.88% rise in fuel prices in the last decade means that New Hampshire will be the only state in the top five cheapest with increasing fuel prices in the next ten years.
4 – Wisconsin: $4,687 ($219 increase)
Wisconsin is estimated to be the fourth cheapest state to own and run a car, this is due to estimated average costs of slightly under $4,500. Wisconsin will see the third-lowest total increase in the next decade, as costs will rise by just over $200.
5 – Oklahoma: $4,716 ($152 decrease)
The final entry into the top five cheapest states in 2031 is Oklahoma, by 2031 estimated costs of running a car in Oklahoma will be over $4,700 which is only slightly more than Wisconsin. Although insurance and fuel costs have gone down in Oklahoma over the past decade it has happened at a lower rate than some of the cheaper states above it.
Methodology
We used a number of factors to calculate the cost of owning and running a Ford F150 in every state today, these factors are: depreciation over a six-year period, insurance, and fuel costs.
We also found figures for these same factors from ten years ago to see the increase or decrease in costs in each state over the past decade.
By following these trends we were able to predict the value of owning and running a Ford F150 ten years from now if current trends continue.
The Ford F150 was chosen as it is the best-selling car in the United States of America.
Car Depreciation Price
- To find the price of the Ford F150 over the years we used data from https://www.thedrive.com/news/34333/heres-how-much-the-ford-f-150-has-increased-in-price-over-the-decades
- The F150 was chosen as it is America’s best selling car: https://www.forbes.com/consent/?toURL=https://www.forbes.com/wheels/news/best-selling-cars-suvs-pickups-2021/
- We looked at owning a car for six years as this is the average length of car ownership.
- By using the car depreciation calculator we were able to discover the estimated value of a Ford F150 after six years with an average annual mileage of 14,300 miles. (14,300 miles is the average driven in the US per year) https://caredge.com/ford/f-150/depreciation?y=0&p=28940&o=5&m=10500
- We then divided this total amount of depreciation by six to discover the average depreciation cost per year of ownership.
Insurance
- To find the 2011 insurance prices we used https://web.archive.org/web/20110316115125/https://www.insure.com/car-insurance/car-insurance-rates.html
- And for 2021 prices we used data from https://www.insure.com/car-insurance/car-insurance-rates.html#average-cost-of-car-insurance-by-state
- We calculated the difference between costs to see which states had the biggest increase and decrease in insurance costs.
Fuel Costs
- We decided to use regular unleaded petrol as that is the most popular fuel type in the country.
- To find out the fuel costs for each state from 2011 we used data from https://www.eia.gov/dnav/pet/hist/LeafHandler.ashx?n=PET&s=EMA_EPM0_PRA_SAL_DPG&f=M for each different state.
- The 2021 data was found at https://www.eia.gov/dnav/pet/hist/LeafHandler.ashx?n=PET&s=EMM_EPMR_PTE_NUS_DPG&f=M
- We then worked out the average amount of fuel needed in a year by finding out the average annual gallons required based on the MPG of the F150 and the average annual mileage of 14,300. https://www.thezebra.com/resources/driving/average-miles-driven-per-year/
- We then multiplied the total amount of gallons needed by the price per gallon to discover the average annual fuel costs.
Predicting the Future
Once we had average prices for both 2011 and 2021, we calculated the percentage change between the prices for the two years, before applying that percentage change to the 2021 prices to estimate how these might look in ten years’ time.
600+ exam-like questions and practice tests
Easy summarized DMV handbook
America’s #1 driver’s ed app with a 95.8% pass rate
Recommended articles
Ace your DMV test, guaranteed
Want to Be the Top School in Your Area?
- Simple & automated admin
- More time for teaching
- #1 learning materials for students
