loved by
15.1+ million
users

Worst and Best Roads – U.S. and International ranking
Where in America and the world are the best and worst roads?
When you learn to drive, living or visiting a place with a high quality of roads can be massively beneficial in many ways: better fuel economy, less tire degradation and vehicle damage, and a more comfortable journey to and from your destinations.
Conversely, poorly maintained roads can be damaging to vehicles and dangerous for all road users. Bad road surfaces can lead to an increase in accidents; which can, in turn, lead to a rise in injuries; and sadly, fatalities.
In 2025 we identified the states with the worst and best roads in America. Furthermore, there are also different standards of world quality throughout the globe; some countries have excellent roads, whilst others do not. This report reveals the countries with the best and worst roads.
US Roads
The scoring system for individual US states was based on slightly different factors than the global rankings due to different data being available. The factors used to rank the US states are: the percentage of all roads that are deemed ‘acceptable’, the three-year change in this value, and the highway fatality rate.
States with the worst roads
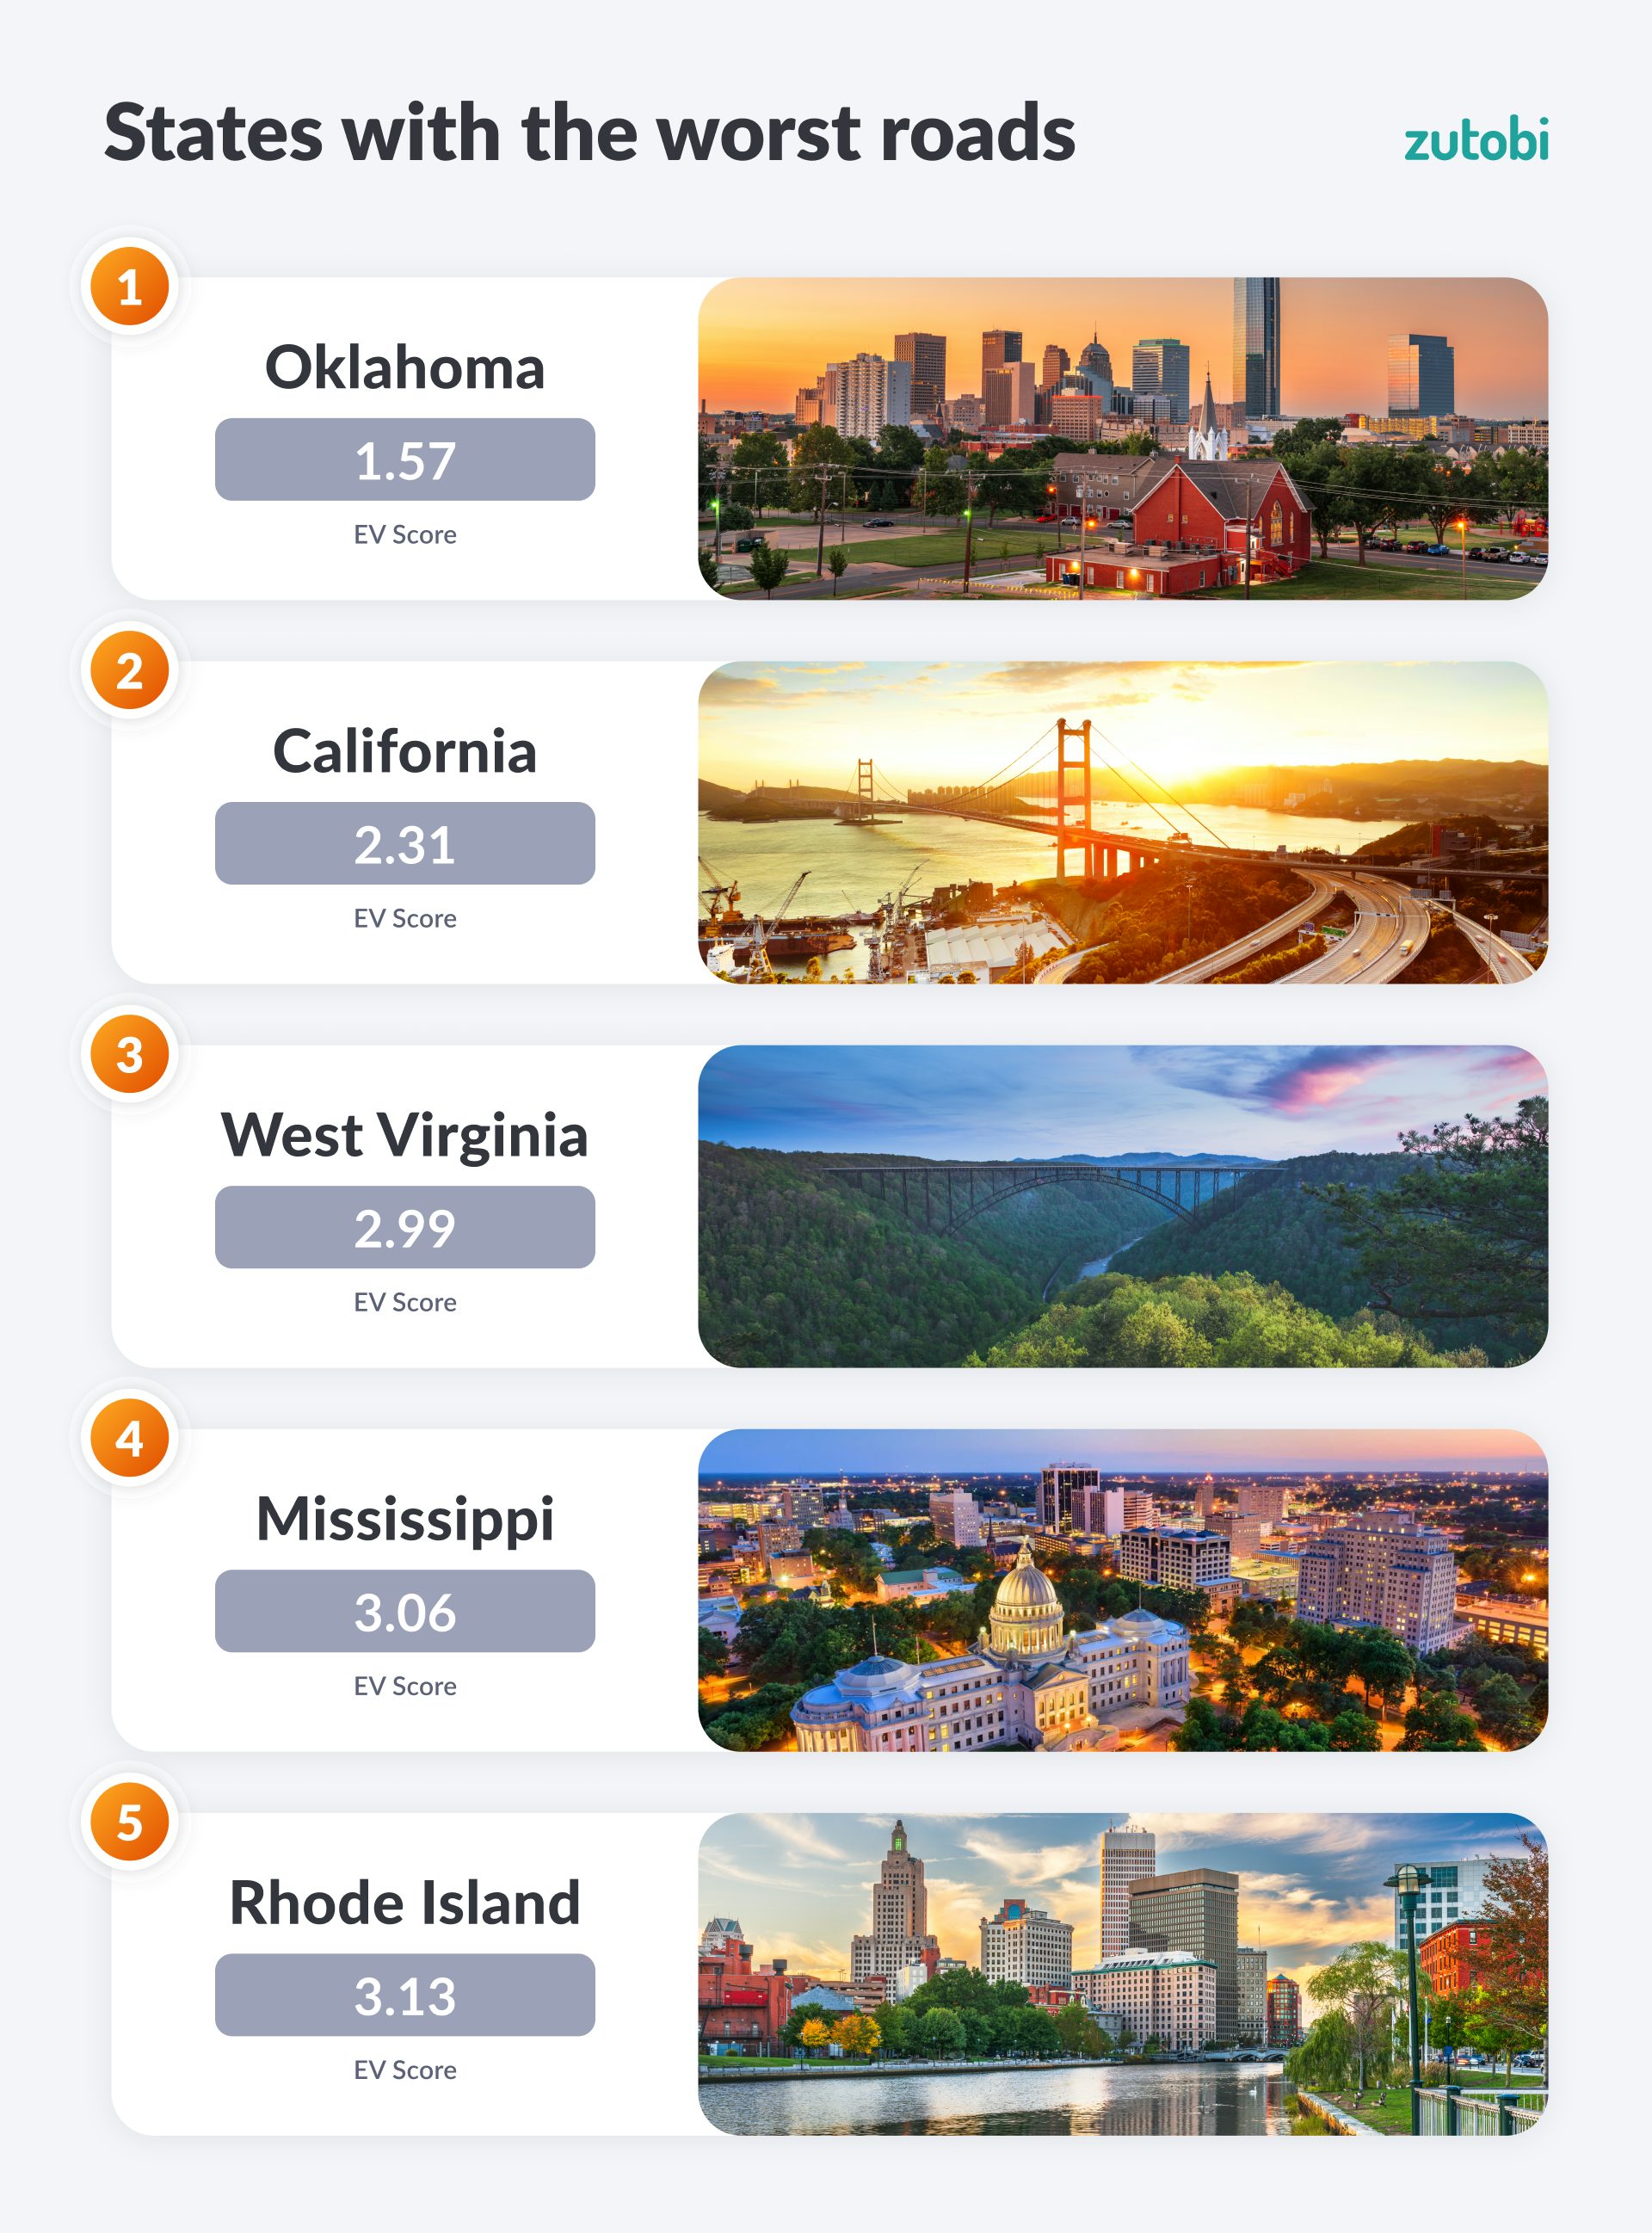
1 – Oklahoma, total road quality score of 1.57/10: The state with the worst roads is Oklahoma, they managed a pitiful score of less than 2/10. The percentage of acceptable roads in the state dropped from 73% in 2020 to just 63% in 2023.
2 – California, total road quality score of 2.31/10: California ranks in the bottom ten states for every ranking category, and as a result of this, it is the state with the second worst roads anywhere in the US.
3 – West Virginia, total road quality score of 2.99/10: Just over the border from California is West Virginia, unfortunately, they are similarly close when it comes to the poor standards of their roads. There is a higher rate of fatalities in West Virginia, but 29% more of their roads reach acceptable standards.
4 – Mississippi, total road quality score of 3.06/10: Unlike all the other states ranking in the top five for the worst roads, the highways in Mississippi are actually getting better, and the level of acceptable roads rose by 3% in three years. Unfortunately, they still have the second highest death rate at 1.79.
5 – Rhode Island, total road quality score of 3.13/10: Rhode Island has the third lowest percentage of acceptable public roads if any state, only 55% of the highways are up to standard on the island state. On the other hand, there is a low highway fatality rate of just 0.94.
States with the best roads
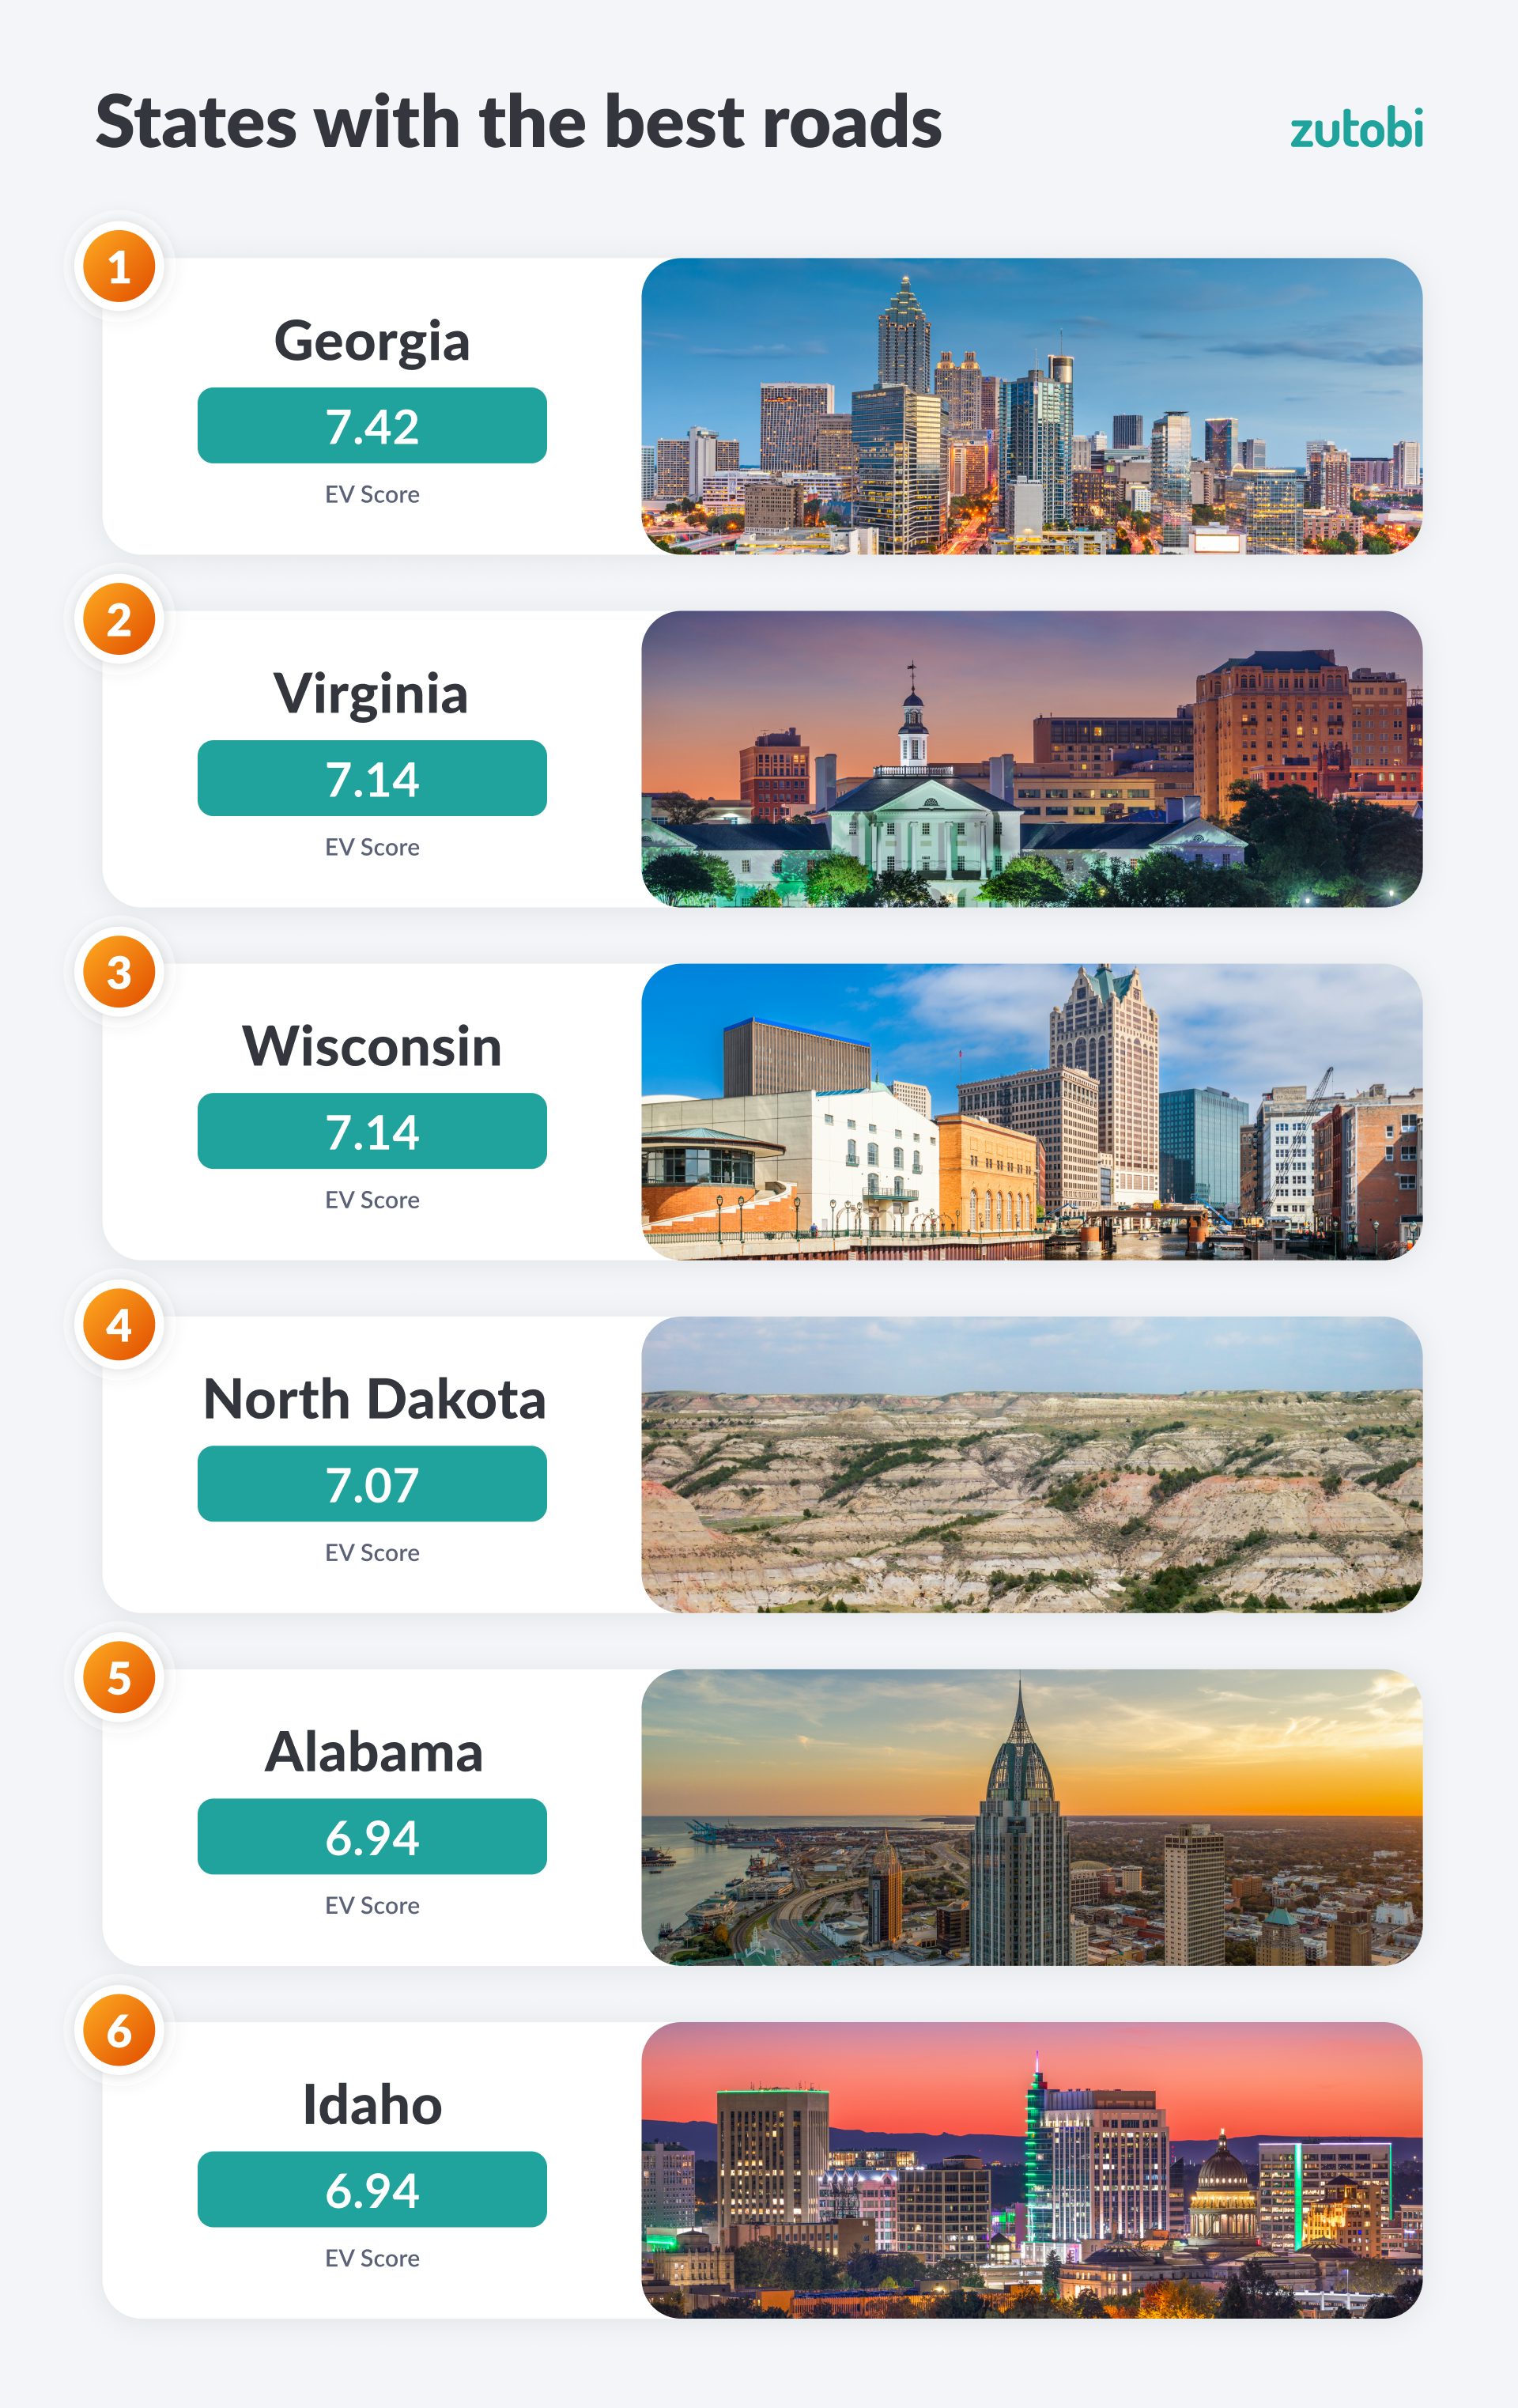
1 – Georgia, total road quality score of 7.42/10: Georgia has the best road score in the United States, in 2023 94% of all roads in the state were in a good condition, this is 3% less than there was three years earlier. There is less than 1.3 highway fatalities per 100 million vehicle miles travelled.
2 – Virginia, total road quality score of 7.14/10: Back in 2020 more roads were acceptable in Virginia than there was in Georgia, but over three years the tables have turned and Virginia now has 11% less of their roads reaching acceptable standards.
3 – Wisconsin, total road quality score of 7.14/10: Wisconsin has the third best roads in the United States, they achieved a score of 7.14 as a result of having a low fatality rate (0.87) and 75% of all their roads being at a good standard.
4 – North Dakota, total road quality score of 7.07/10: Despite 93% of all roads in North Dakota being in an acceptable condition, the state only ranked in fourth place overall. There was 1.07 highway fatalities per 100 million vehicle miles travelled, this is the highest of any state in the top 5 of the rankings.
5 – Alabama, total road quality score of 6.94/10: Alabama completes the top five states with the best roads, 92% of the roads in the state are acceptable, a rise of 4% since 2020. Concurrently there is a death rate of just 1.35 on the Alabama roads.5 – Idaho, total road quality score of 6.94/10: Idaho ties with Alabama for fifth place with the same overall score. 94% of the roads in the state are acceptable, a drop of 3% since 2020. There is a death rate of 1.39 on the Idaho roads.
| Rank | State | Acceptable’ miles of public road (2023) | Three-year change | Highway fatality rate (per 100 million vehicle miles traveled) | Average Daily Person Miles | Overall score |
|---|---|---|---|---|---|---|
1 | Georgia | 94% | 3.29% | 1.28 | 37.7 | 7.42 |
| 2 | Virginia | 83% | 5.67% | 1.04 | 40.9 | 7.14 |
| 2 | Wisconsin | 75% | 8.28% | 0.87 | 37.1 | 7.14 |
| 4 | North Dakota | 93% | 0.07% | 1.07 | 32.5 | 7.07 |
| 5 | Alabama | 92% | -3.47% | 1.35 | 48.5 | 6.94 |
| 5 | Idaho | 94% | 3.13% | 1.39 | 23.4 | 6.94 |
| 7 | Indiana | 97% | -4.88% | 1.05 | 35.7 | 6.80 |
| 8 | Minnesota | 91% | -5.44% | 0.70 | 53.0 | 6.53 |
| 9 | Nebraska | 93% | -2.71% | 1.07 | 28.9 | 6.39 |
| 10 | North Carolina | 88% | 1.47% | 1.28 | 36.4 | 6.26 |
| 11 | Iowa | 91% | -0.66% | 1.13 | 38.3 | 6.19 |
| 12 | Vermont | 95% | -12.75% | 0.96 | 30.5 | 6.05 |
| 13 | Maryland | 71% | 16.72% | 1.08 | 42.0 | 5.92 |
| 14 | Utah | 89% | -10.28% | 0.81 | 30.2 | 5.71 |
| 15 | Kansas | 96% | -7.79% | 1.22 | 28.2 | 5.65 |
| 16 | Nevada | 85% | 2.12% | 1.40 | 25.5 | 5.58 |
| 17 | Ohio | 86% | -2.26% | 1.10 | 29.2 | 5.51 |
| 17 | Tennessee | 94% | 0.55% | 1.59 | 42.8 | 5.51 |
| 19 | Maine | 83% | -5.67% | 0.91 | 33.9 | 5.44 |
| 19 | New York | 75% | -0.73% | 0.93 | 30.5 | 5.44 |
| 21 | Alaska | 78% | -0.64% | 1.07 | 31.9 | 5.37 |
| 21 | Florida | 87% | 1.06% | 1.42 | 33.4 | 5.37 |
| 23 | Massachusetts | 74% | -4.18% | 0.56 | 31.2 | 5.31 |
| 23 | Texas | 77% | 12.32% | 1.43 | 38.1 | 5.31 |
| 25 | Illinois | 80% | 0.37% | 1.21 | 34.0 | 5.17 |
| 26 | Colorado | 76% | 2.03% | 1.32 | 40.7 | 5.11 |
| 27 | Kentucky | 91% | 1.12% | 1.66 | 40.4 | 5.10 |
| 27 | New Hampshire | 83% | -6.61% | 0.96 | 34.0 | 5.10 |
| 27 | South Dakota | 95% | -9.40% | 1.35 | 46.5 | 5.10 |
| 30 | Oregon | 89% | 0.93% | 1.59 | 30.7 | 4.96 |
| 31 | New Jersey | 82% | -29.00% | 0.78 | 42.3 | 4.63 |
| 32 | Missouri | 76% | -0.22% | 1.23 | 32.5 | 4.56 |
| 33 | Michigan | 84% | -6.94% | 1.11 | 36.4 | 4.49 |
| 33 | Montana | 89% | -1.20% | 1.52 | 38.2 | 4.49 |
| 35 | Delaware | 84% | -2.52% | 1.39 | 43.1 | 4.35 |
| 36 | Hawaii | 61% | -4.51% | 0.89 | 27.9 | 4.15 |
| 37 | Pennsylvania | 73% | -1.13% | 1.21 | 32.7 | 4.01 |
| 37 | Wyoming | 95% | -14.48% | 1.51 | 40.4 | 4.01 |
| 39 | Arizona | 74% | 7.15% | 1.73 | 49.1 | 3.94 |
| 40 | Washington | 70% | 0.73% | 1.35 | 40.4 | 3.88 |
| 41 | Connecticut | 70% | -5.13% | 1.01 | 29.5 | 3.74 |
| 41 | South Carolina | 81% | 0.80% | 1.72 | 38.5 | 3.74 |
| 43 | Louisiana | 74% | 0.37% | 1.46 | 29.2 | 3.47 |
| 44 | Arkansas | 83% | -2.87% | 1.52 | 26.6 | 3.40 |
| 44 | New Mexico | 67% | 2.87% | 1.55 | 35.1 | 3.40 |
| 46 | Rhode Island | 55% | -10.55% | 0.94 | 26.3 | 3.13 |
| 47 | Mississippi | 70% | 3.05% | 1.79 | 37.0 | 3.06 |
| 48 | West Virginia | 92% | -22.25% | 1.63 | 25.2 | 2.99 |
| 49 | California | 72% | -13.26% | 1.28 | 35.8 | 2.31 |
| 50 | Oklahoma | 73% | -10.22% | 1.57 | 45.0 | 1.57 |
International Roads
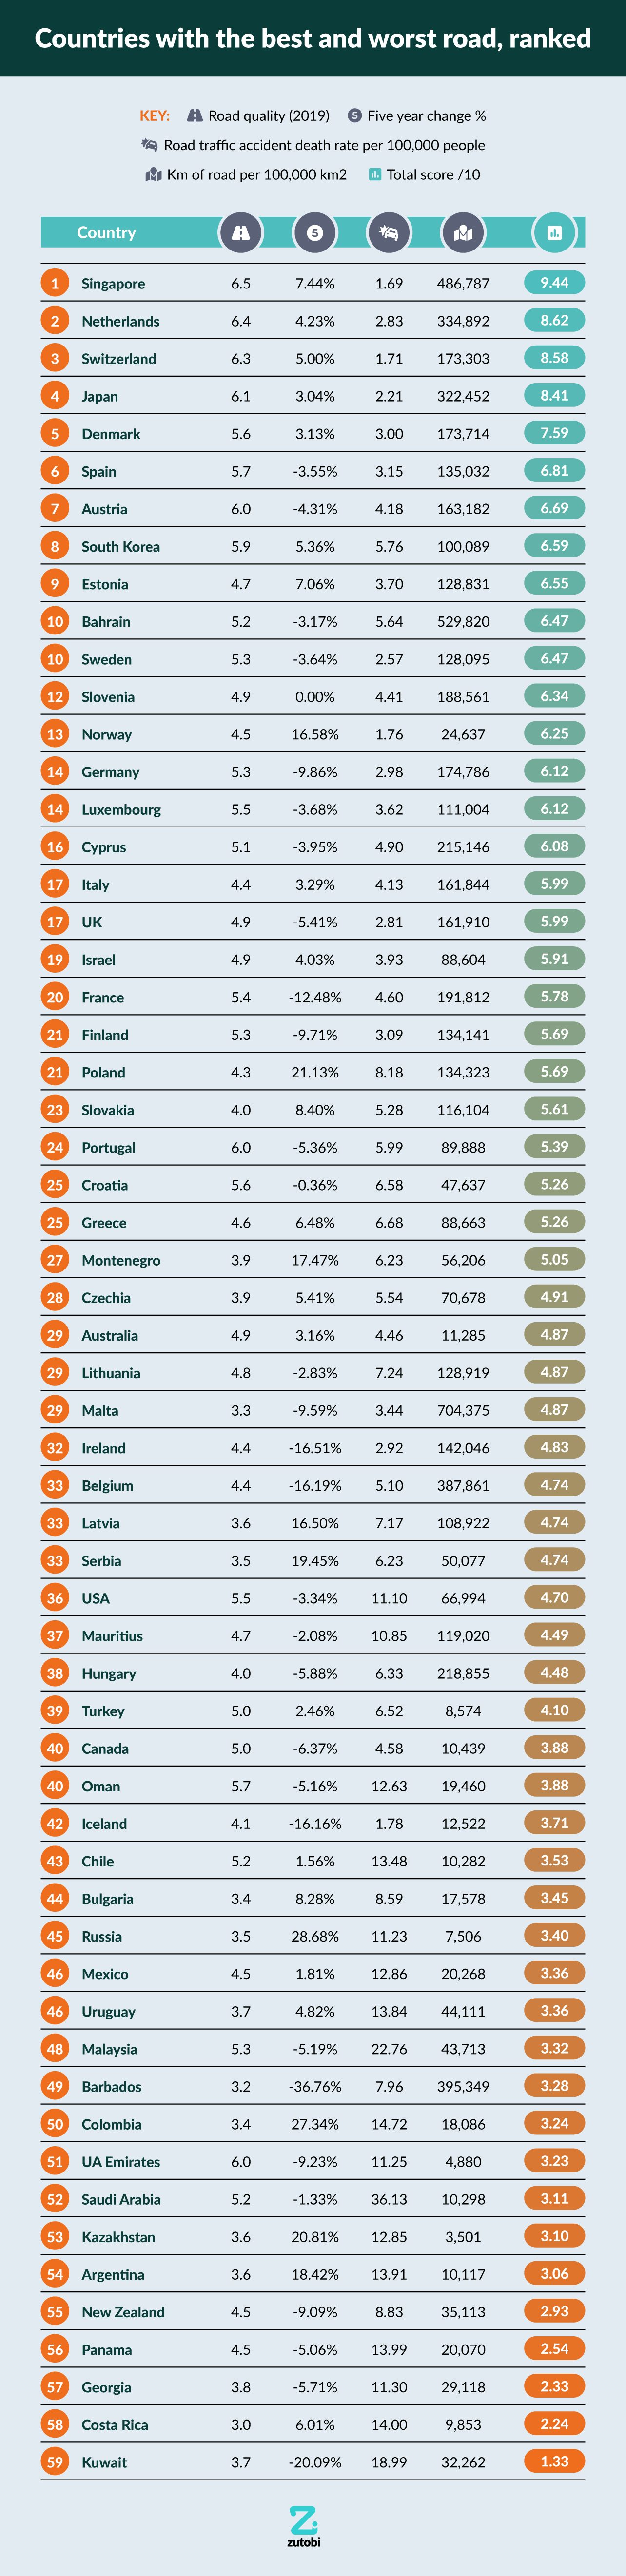
Out of all the countries in the world, 59 were analyzed, these were either OECD member nations or countries with a score of eight or higher on the HDI. Further nations were removed from the rankings, as there was incomplete or missing data in those places. The road quality score is calculated using these factors: road quality, improvements in road quality, road deaths, and the relative size of the road network.
Countries with the worst roads
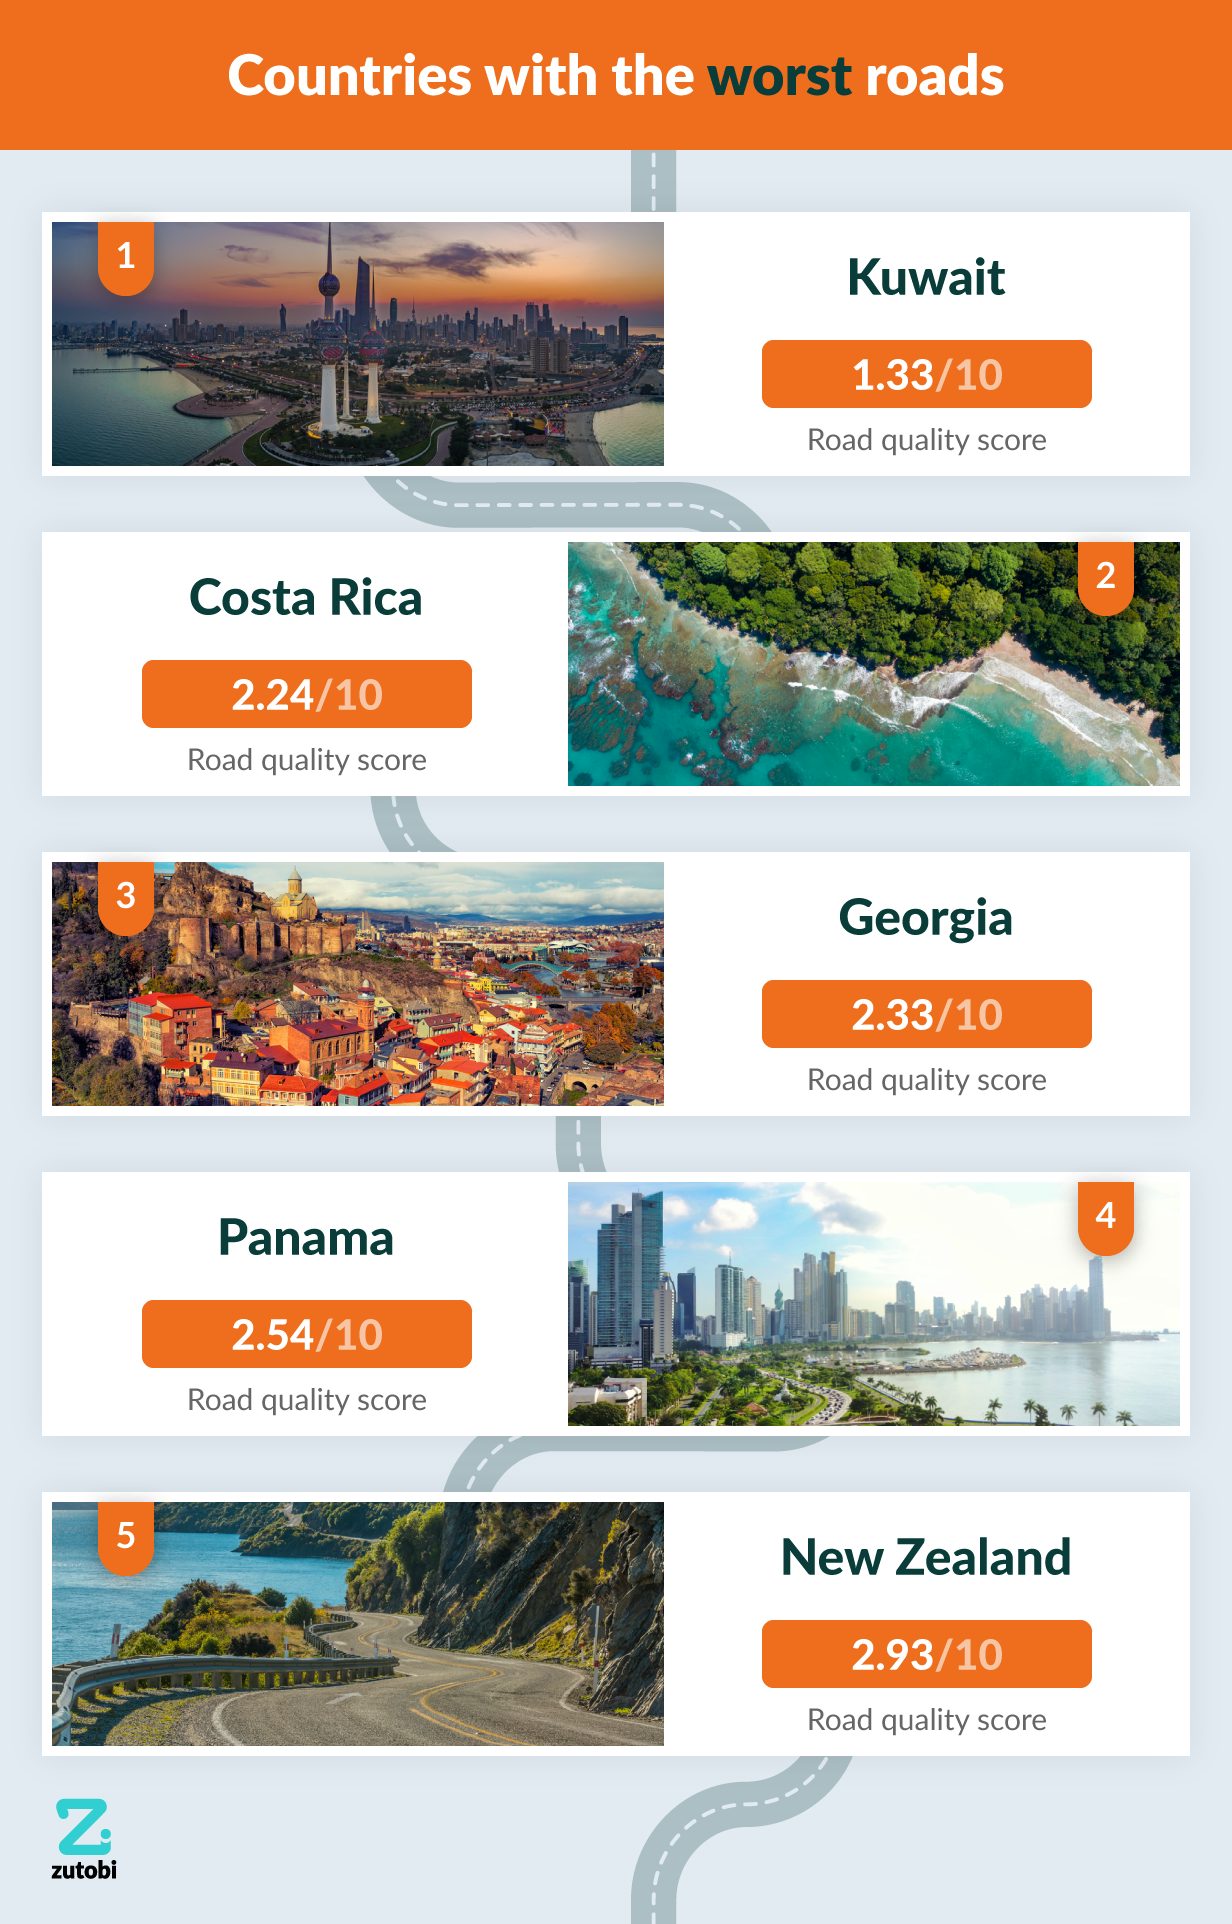
1 – Kuwait, total road quality score of 1.33/10:
The country with the worst quality roads is Kuwait. The road quality score has dropped by more than 20% in five years, it was 4.6 in 2014 then dropped to 3.7 by 2019. Kuwait also has the third highest number of road traffic deaths per 100,000 people, almost 19.
2 – Costa Rica, total road quality score of 2.24/10:
There are five fewer people per 100,000 dying on the roads in Costa Rica, but the road quality score is 0.7 lower in the Central American nation than it was in Kuwait. Moreover, the road quality score of 3/10 is the lowest of any country studied.
3 – Georgia, total road quality score of 2.33/10:
Georgia sits right at the crossroads of Europe and Asia; the capital city, Tbilisi is within 500 miles of both the Black Sea and the Caspian Sea. Georgia ranked in the bottom 15 countries for all but one category.
4 – Panama, total road quality score of 2.54/10:
Panama borders Costa Rica, they have slightly nicer roads, but they still had a low score of just over 2.5. The road quality in Panama is getting worse, dropping by over 5% from 4.7 to 4.5 in 5 years. There are 13.99 road traffic death rates per 100,000 of the population on Panama’s highways.
5 – New Zealand, total road quality score of 2.93/10:
The roads in New Zealand are often mountainous, winding and narrow due to the nature of the spectacular landscape the country is famous for. These roads can be challenging to drive, and they have deteriorated by over 9% in the past five years, in 2014 they scored 5, but this dropped to 4.5 by 2019, one contributing factor could be the 2016 Kaikoura earthquake which destroyed a large section of the state highway 1 (New Zealand’s biggest road).
Countries with the best roads
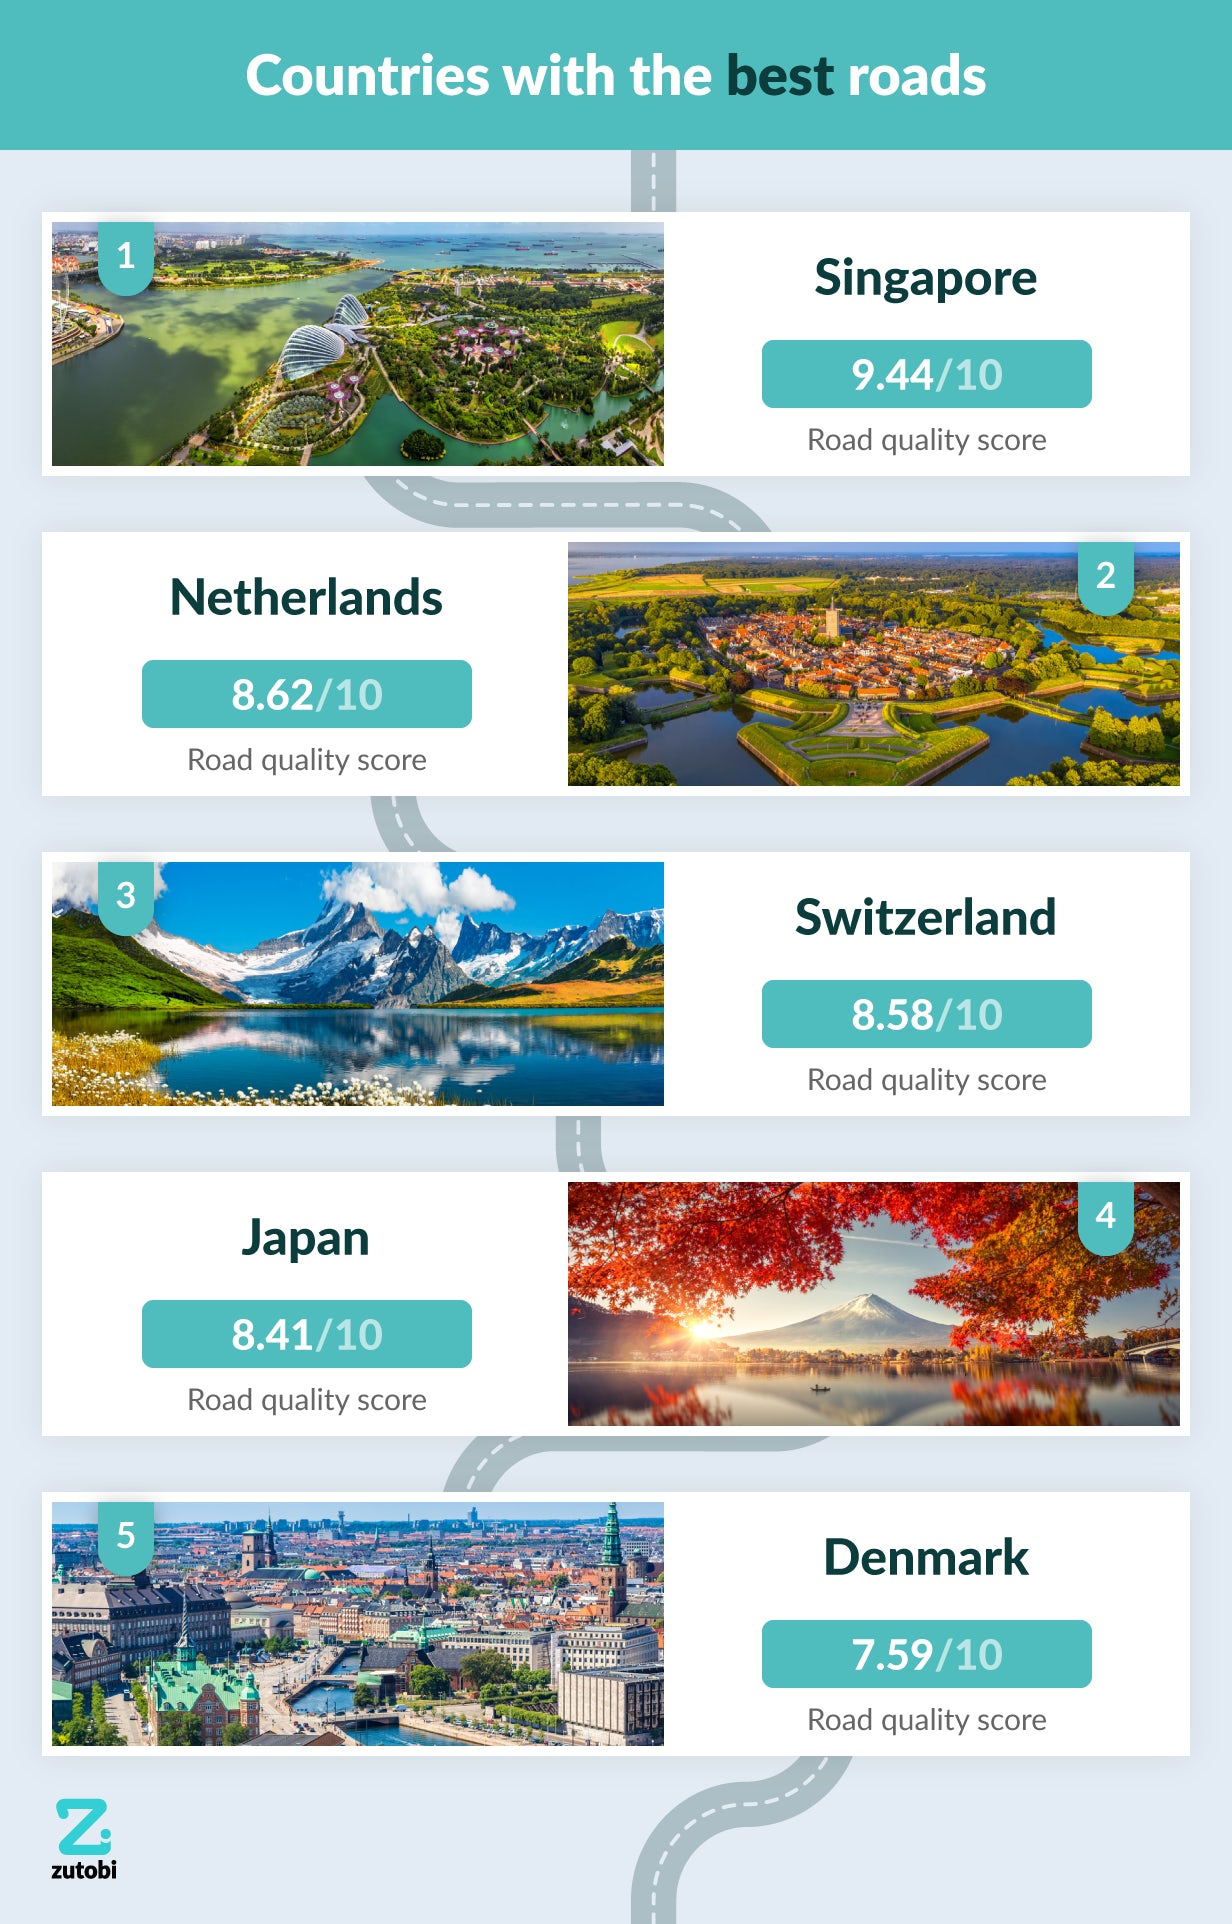
1 – Singapore, total road quality score of 9.44/10:
Singapore has by far the highest overall road score, as it is the only nation to score higher than 9/10. It has the best road quality, as well as the fewest road traffic deaths, 1.69 per 100,000 people.
2 – Netherlands, total road quality score of 8.62/10:
The Netherlands has the second best roads in the world, despite having better roads than Singapore in 2014 they have since been surpassed. The Netherlands ranked in the top ten for all but one of the categories.
3 – Switzerland, total road quality score of 8.58/10:
The Swiss roads are only 0.4 points behind the Dutch roads, which edges them into third place in the rankings. Switzerland has some spectacular alpine drives such as the Furka Pass, and thankfully these epic roads are kept in good quality.
4 – Japan, total road quality score of 8.41/10:
Japan is the final country to have roads with a higher overall score than 8/10. Japan ranks in the top five countries for road quality, road traffic deaths, and the length of road per 100,000 km2.
5 – Denmark, total road quality score of 7.59/10:
The final entry into the top five is Denmark, which achieved a score of 7.59. Denmark has quite low speed-limits for non-motorway rural roads, as they are all set at 80 kmh (51 mph). Also, there are only 2.21 deaths on the road per 100,00 people.
Methodology
Global
- The area of each country and the length of its road network were sourced from Worlddata.info. We then calculated the km of road per 100,000 km2
- The road quality score per country was sourced from TheGlobalEconomy.com, we collected data from the most recent recorded year (2019), and five years earlier (2014).
USA
- Total miles of public roads, as well as the percentage of acceptable miles, were sourced from the Bureau of Transportation. The most recent data is from 2020, and we compared this to five years earlier (2015).
- Fatalities per state on the road were also sourced from the Bureau of Transportation.
For both rankings, each country or state was given a normalized score out of 10 for each factor, before an average of these scores was taken.
Previous reports

Take our full course with tests and theory
600+ exam-like questions and practice tests
Easy summarized DMV handbook
America’s #1 driver’s ed app with a 95.8% pass rate
Recommended articles


Ace your DMV test, guaranteed
Want to Be the Top School in Your Area?
- Simple & automated admin
- More time for teaching
- #1 learning materials for students
Start learning now
Resources
- Driver’s License Renewal
- How to Get Your US Driver’s License
- How to Prepare for Your Road Test
- How to Get a Driver’s Permit
- Behind-The-Wheel training
- Courses
- Blog
- FAQ
Show More
©2026 Zutobi AB, 4 Peddlers Row, Unit #103, Newark, DE 19702