loved by
15.1+ million
users
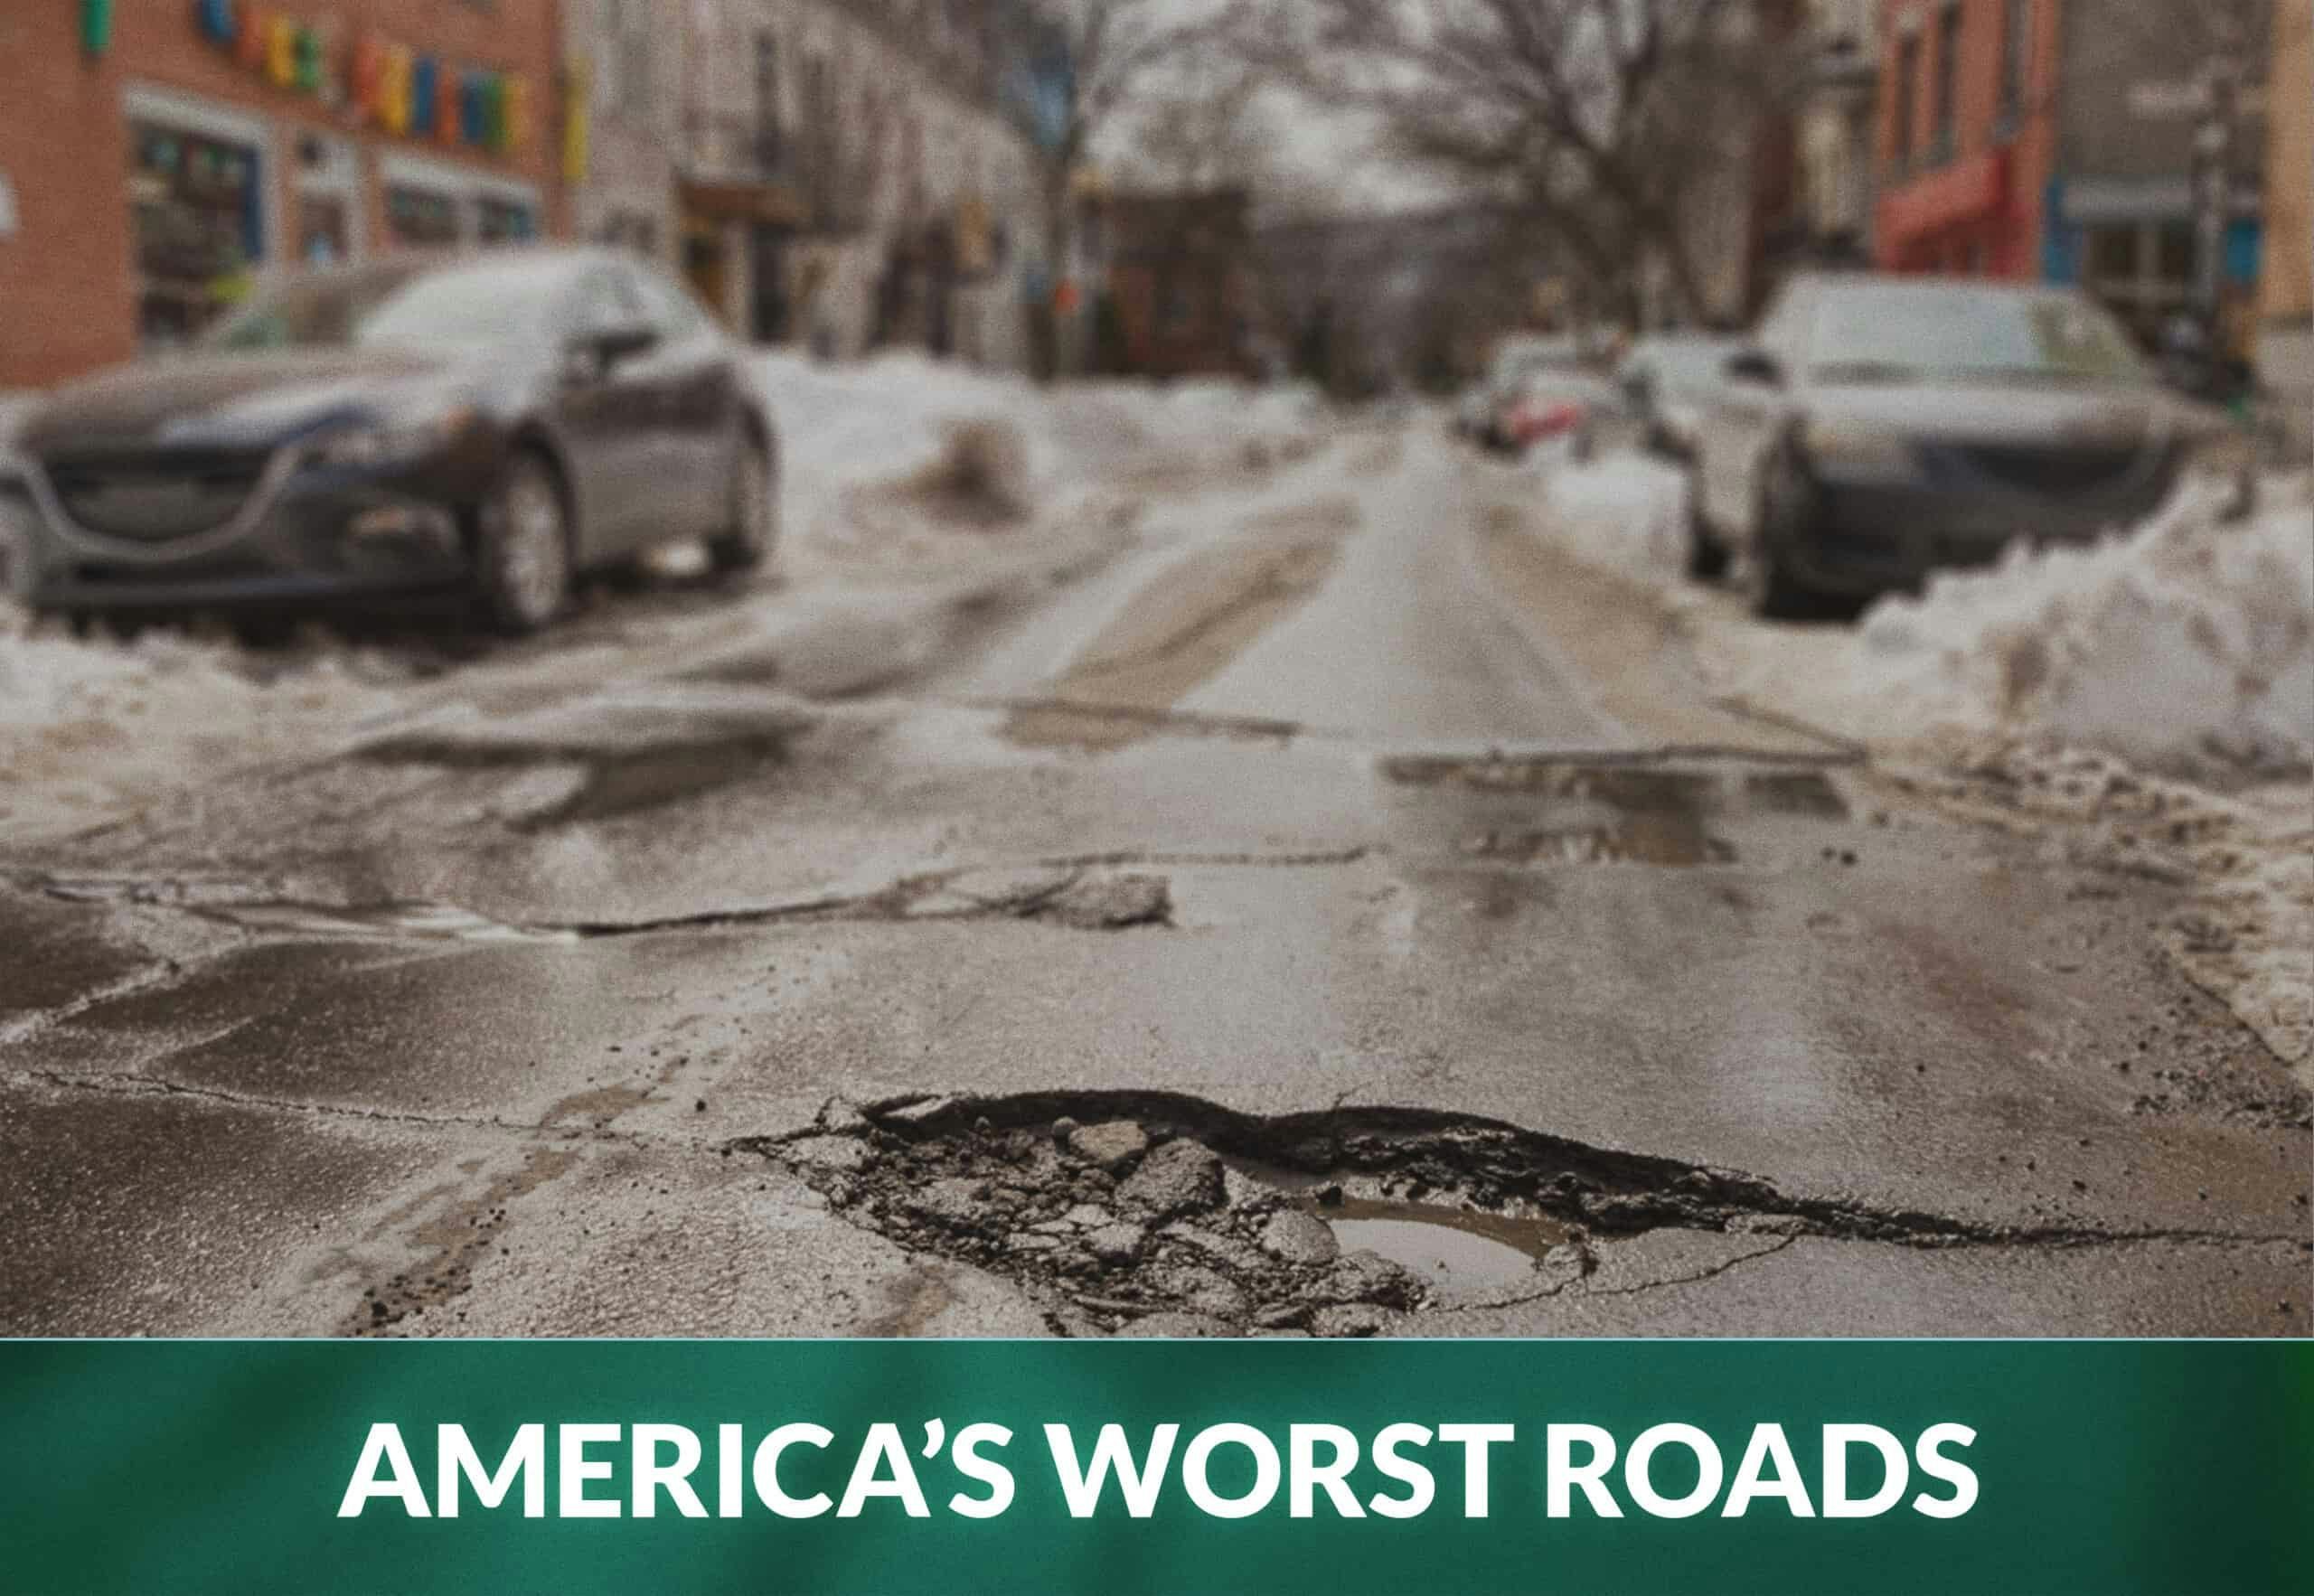
The States with the Best and Worst Roads in America
Not only do badly maintained roads add time to our journeys, but they can also cost drivers serious money, as well as significant damage to the vehicles they’re driving.
Sub-par road surfaces also reduce fuel efficiency so you’ll need to refuel more often, increasing your emissions as well as the cost of driving. The quality of the road you’re driving on can also significantly affect how easy or difficult you find learning to drive.
But, how well maintained are actually the roads in America? We’ve taken a deep dive into the latest data to find out which states have the worst roads, and which have the best.
States with the Worst Roads
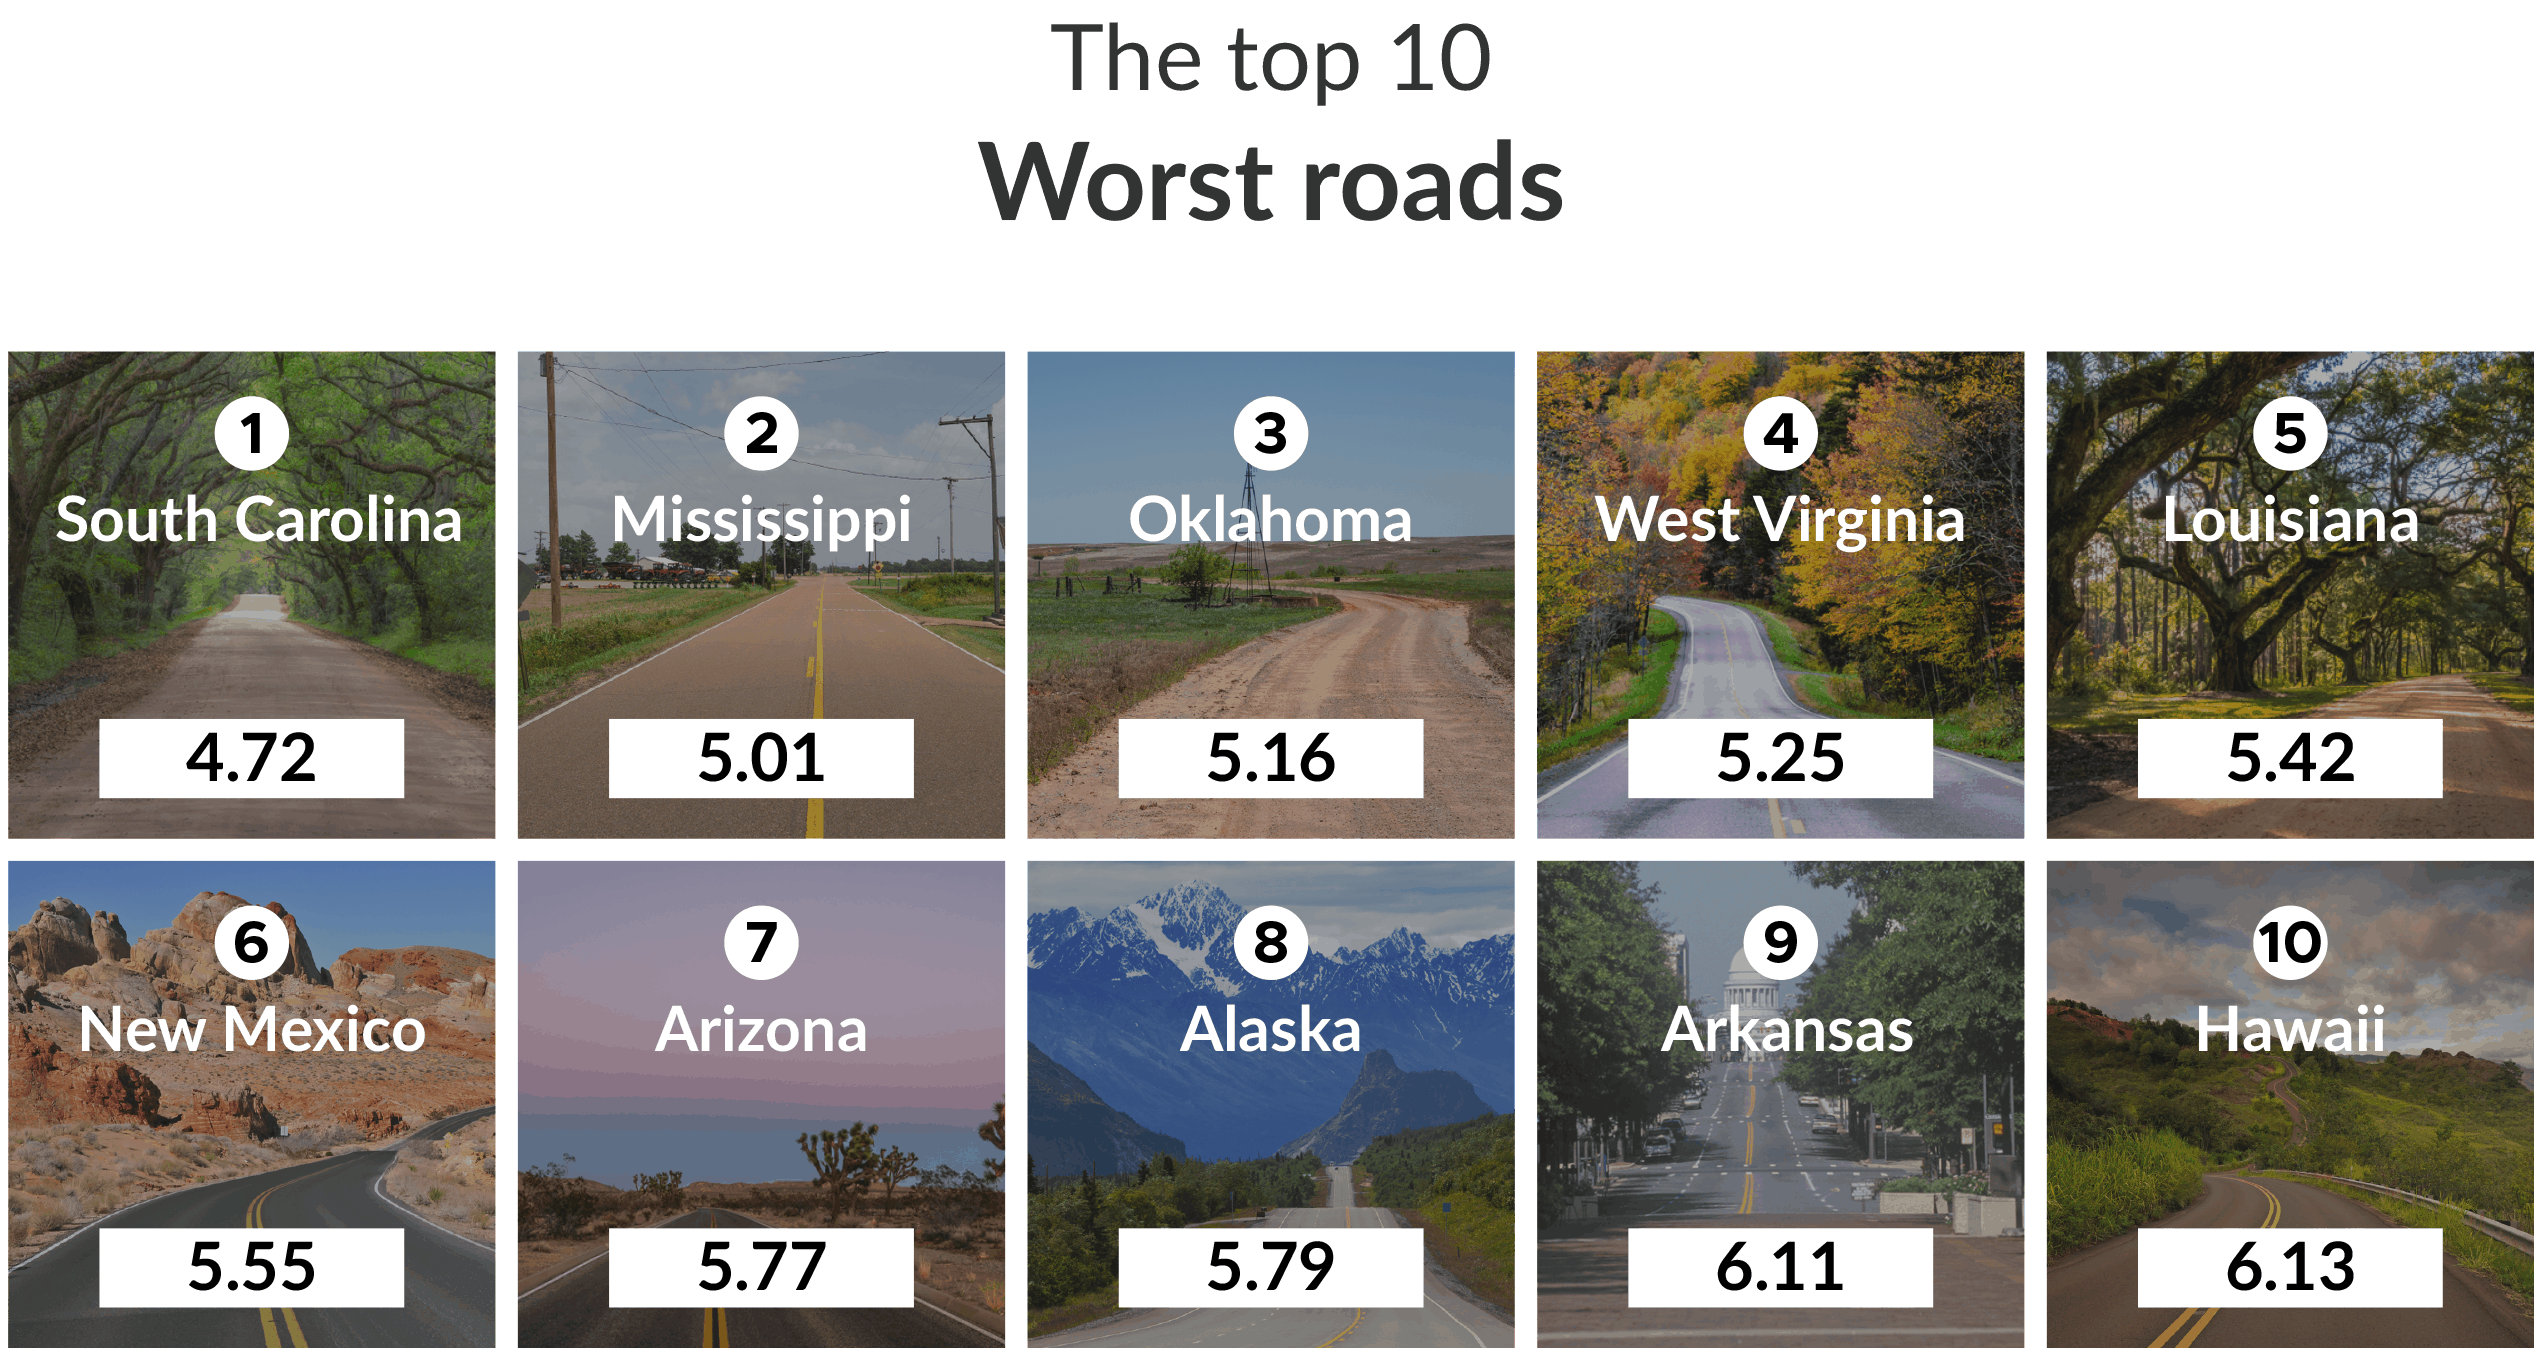
1. South Carolina. Score: 4.72 / 10
Coming in at the very bottom with the worst roads in the country is South Carolina. It’s the only state to be scored below 50% on just 4.72, and it has the highest highway fatality rate of 1.83.
2. Mississippi. Score: 5.01 / 10
The next entry, just making it above a score of 5, is Mississippi. Over 20,000 miles of public roads in Mississippi did not meet an acceptable standard, contributing to its low score.
3. Oklahoma. Score: 5.16 / 10
Oklahoma’s low score is due to it having one of the highest levels of unacceptable quality roads in the country, with less than two-thirds being rated acceptable to drive on.
4. West Virginia. Score: 5.25 / 10
The Mountain State claims 4th place with a score of 5.25, which is indicative of the poor standard of roads.
5. Louisiana. Score: 5.42 / 10
Having recorded 768 highway fatalities in 2018, Louisiana’s fatality rate is higher than most at 1.53. This has greatly contributed to its low overall score.
6. New Mexico. Score: 5.55 / 10
Of the 77,605 miles of public road in New Mexico, over 30% is rated unacceptable, earning it 6th place.
7. Arizona. Score: 5.77 / 10
Arizona’s roads are actually in pretty good shape considering its harsh desert environment, but the 1,010 highway deaths recorded in 2018 bring its overall score down to 5.77.
8. Alaska. Score: 5.79 / 10
Alaska is the most northerly state in the US, and also the most sparsely populated. The often tricky terrain and icy conditions make accidents more likely and roads more difficult to maintain.
9. Arkansas. Score: 6.11 / 10
The people of Arkansas drive 26.6 miles per day on average, which is almost 10 miles less than the US average. This low score won’t encourage them to change that.
10. Hawaii. Score: 6.13 / 10
The final entry in our 10 states with the worst roads is Hawaii. The Aloha State has the smallest public road network in the country, totaling only 4475 miles in length. However barely half of this network is considered of acceptable quality, with 43.6% requiring improvement.
States with the Best Roads
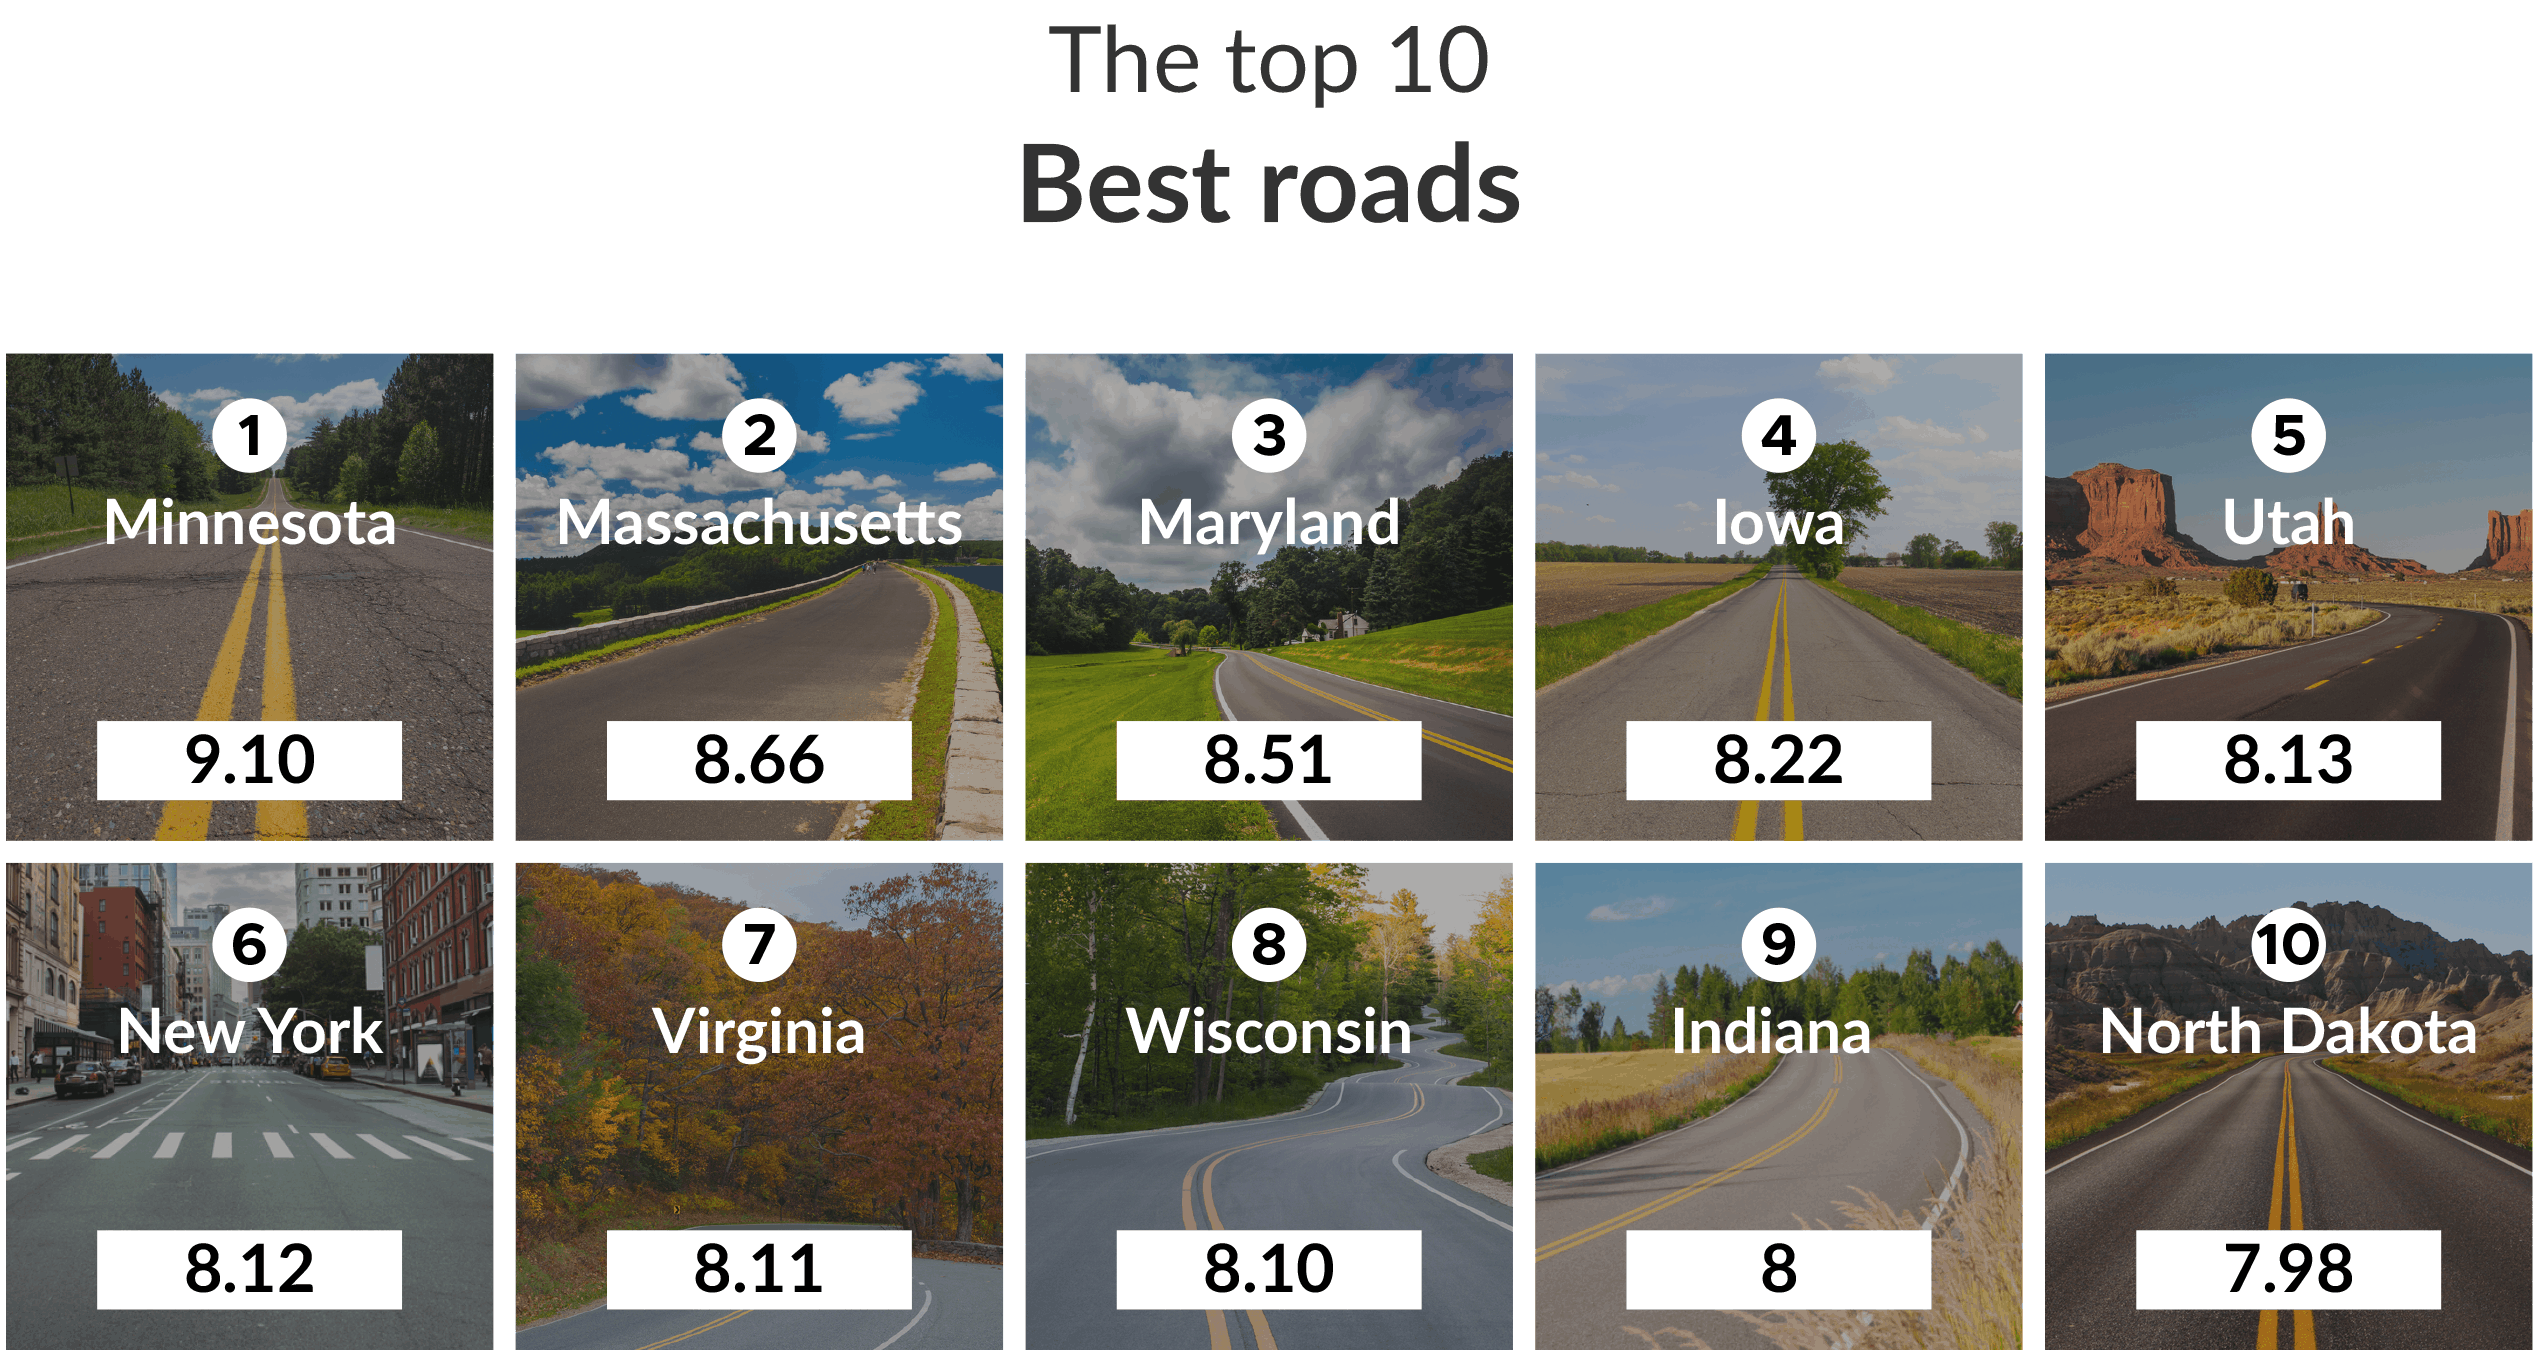
1. Minnesota. Score: 9.10 / 10
Minnesota came 1st and ranked as the best place to drive in the country. The vast majority (85.1%) of this mid-western state’s roads are well maintained, and it has a very low highway fatality rate of 0.61 (per 100 million vehicle miles traveled).
2. Massachusetts. Score: 8.66 / 10
Coming in at second place with a highly respectable score of 8.66 is Massachusetts. The Bay State did particularly well with the lowest highway mortality rate of any state at just 0.54.
3. Maryland. Score: 8.51 / 10
The roads in Maryland are in great condition, despite the average Marylander driving 42 miles each day. With so much driving practice it’s no wonder that they’re also some of the safer drivers you’ll find.
4. Iowa. Score: 8.22 / 10
Another area in the midwest, Iowa comes 4th with a score of 8.22. Despite having a slightly higher fatality rate, the roads are in excellent condition, with over 90% being rated acceptable or higher.
5. Utah. Score: 8.13 / 10
Home to the Bonneville Salt Flats, Utah has a strong history and connection with motor vehicles, so it’s no surprise that the state came a strong 5th. Utah is also the most westerly state to make our top 10.
6. New York. Score: 8.12 / 10
The 12.2 million licensed drivers in New York State have got some of the best roads in the country. Such large traffic volumes could cause some serious wear and tear, so it’s clear that the roads are kept in top conditions.
7. Virginia. Score: 8.11 / 10
The fourth east-coast state to make the list is Virginia with a score of 8.11. The average Virginian drives over 40 miles a day, meaning well-kept roads are vital to keeping the state moving.
8. Wisconsin. Score: 8.10 / 10
Virginia is followed closely by Wisconsin, with just a 0.01 difference in their scores. While there are slightly fewer fatalities in Wisconsin (a rate of 0.89), the road quality wasn’t quite good enough to make 7th place.
9. Indiana. Score: 8 / 10
Indiana is another state with a strong passion for motor vehicles, as it hosts the annual Indy 500 in the town of Speedway. It takes 9th place with a score of 8.00.
10. North Dakota. Score: 7.98 / 10
Filling the final spot in our top 10 is North Dakota. It may be the only entry to receive a score below 8, but with 93.4% of its roads rated acceptable or better, it more than deserves its place.
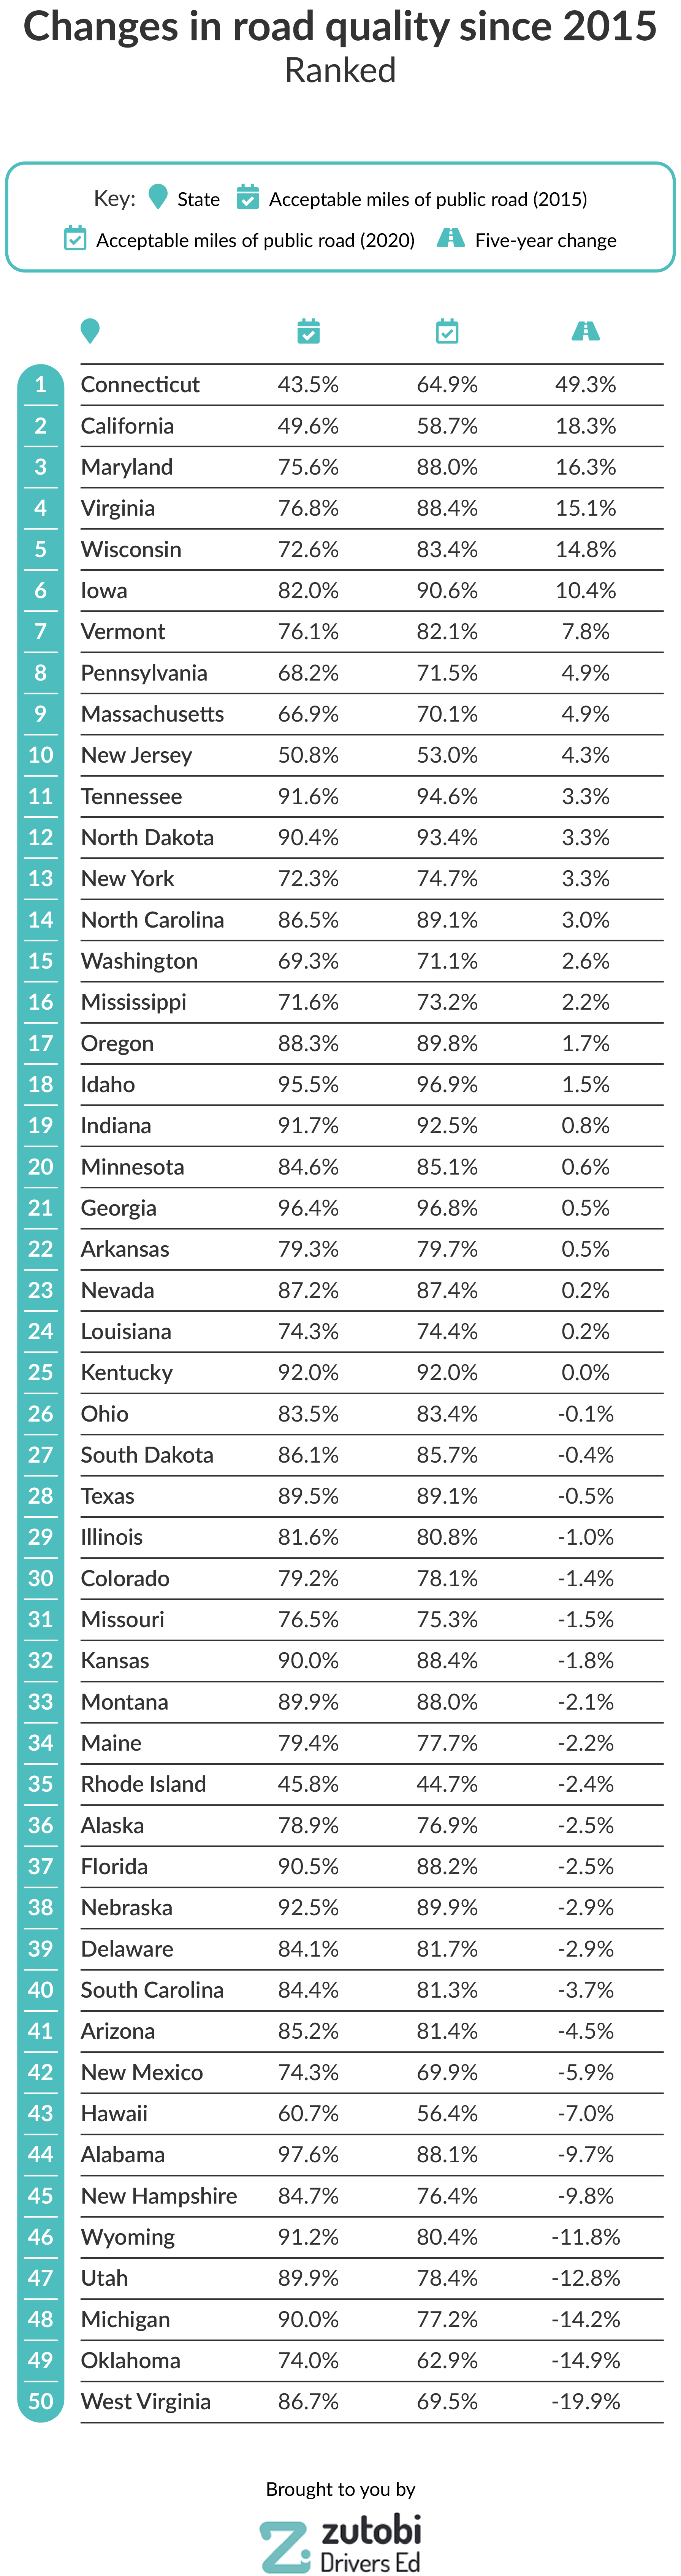
States with the Most (and Least) Improved Roads Since 2015
Connecticut has experienced by far the biggest increase in road surface quality since 2015, with a 49.3% increase in the proportion of its roads rated acceptable or higher. The next most-improved is California with an increase of 18.3%.
In contrast, West Virginia’s roads are deteriorating at the quickest rate, with a 19.9% decrease in the number of acceptable quality roads over the last five years.
The public road network in the United States is almost 4.2 million miles long and continues to grow.
While the quality of roads in each state varies dramatically the overall trend is positive, with the total miles of acceptable roads increasing by 4.3% since 2015.
Where do your state’s roads rank?
Methodology
To determine which states had the worst roads, we used data from the United States Bureau of Transportation Statistics website. This data showed us the total miles of roads in each state, and how much of it was deemed acceptable according to the International Roughness Index.
The most recent data available on road surface quality was recorded in 2020 and was used to indicate current levels. We compared this data with records from 2015 to get a view of the changes over the last 5 years.
We also considered additional factors such as the rate of highway deaths to calculate an overall score for the roads in each state.
Sources:
- Bts.gov – Road Condition Data 2020 & Other Metrics
- Bts.gov – Road Condition Data 2000 & 2015
- Worldhighways.com – The Importance of Road Maintenance
- Worldhighways.com – Bad Roads Make People Poorer
- Roadsafetyfacts.eu – What Role Do Road Users And Infrastructure Play In Improving Safety
- Pothole.info – Do Rough Roads Hurt Fuel Efficiency
- Statista.com – US States by Population Density
Who is behind this study?
Zutobi is an online driver’s education company with the goal to make the roads a safer place. Instead of just helping students prepare for the permit test, our top priority is to teach about driving safety practices and driver safety to create better, and safer, drivers.

Take our full course with tests and theory
600+ exam-like questions and practice tests
Easy summarized DMV handbook
America’s #1 driver’s ed app with a 95.8% pass rate
Recommended articles


Ace your DMV test, guaranteed
Want to Be the Top School in Your Area?
- Simple & automated admin
- More time for teaching
- #1 learning materials for students
Start learning now
Resources
- Driver’s License Renewal
- How to Get Your US Driver’s License
- How to Prepare for Your Road Test
- How to Get a Driver’s Permit
- Behind-The-Wheel training
- Courses
- Blog
- FAQ
Show More
©2026 Zutobi AB, 4 Peddlers Row, Unit #103, Newark, DE 19702