loved by
15.1+ million
users

The 2026 Motoring Projections Report
How much will it cost to run a new car in ten years’ time?
Last year, we brought you the original motoring projections, but since then a lot has changed in the world of motoring. And the landscape of the costs of running a car in ten years looks very different to twelve months prior.
The massive rise in fuel costs around the globe is something that could not have been predicted last year, and this is one of the factors that has been taken into account in the updated motoring projections.
Additionally, we have used the following factors to reveal the cost of owning and running a car in the United States in ten years’ time:
- Cost of the average depreciation in vehicle value over six years. We have then divided these values by six to get an average of the cost for each year
- Cost of six years of fuel
- Cost of six years of insurance
To create a fair system we decided to base the data on America’s most popular car, the Ford F-150 pickup truck. A new generation of this car was released this year, and the base model of this car across the country costs $30,870 which is almost $9,000 more than the $22,000 it cost in 2012, which constitutes a 40% rise.
The annual average mileage of US motorists is 7,400 miles, and the F-150 achieves an average of 25 MPG, therefore you need to buy on average 296 gallons of fuel to run it for a year, or 1,776 gallons over six years. Insurance costs per state were the third factor used to project the cost in each state.
A year of change
Before we reveal the projections of how current trends in motoring costs will have changed by 2032, we first have to show how these costs have dramatically changed in the past twelve months. A number of factors (mainly the war in Ukraine) have pushed the price of fuel up dramatically, across the United States the average annual fuel cost has risen by almost 60%, this is a rise of over $1,000 for the typical American driver.
The overall price of driving has not risen as dramatically as the fuel costs, but it has still shot up by an average of 15% nationwide. This is because the insurance costs have stayed the same, and the annual depreciation on the new F150 model has dropped by $273 from last year in every state. In some states, the price of driving has increased far more than in others…
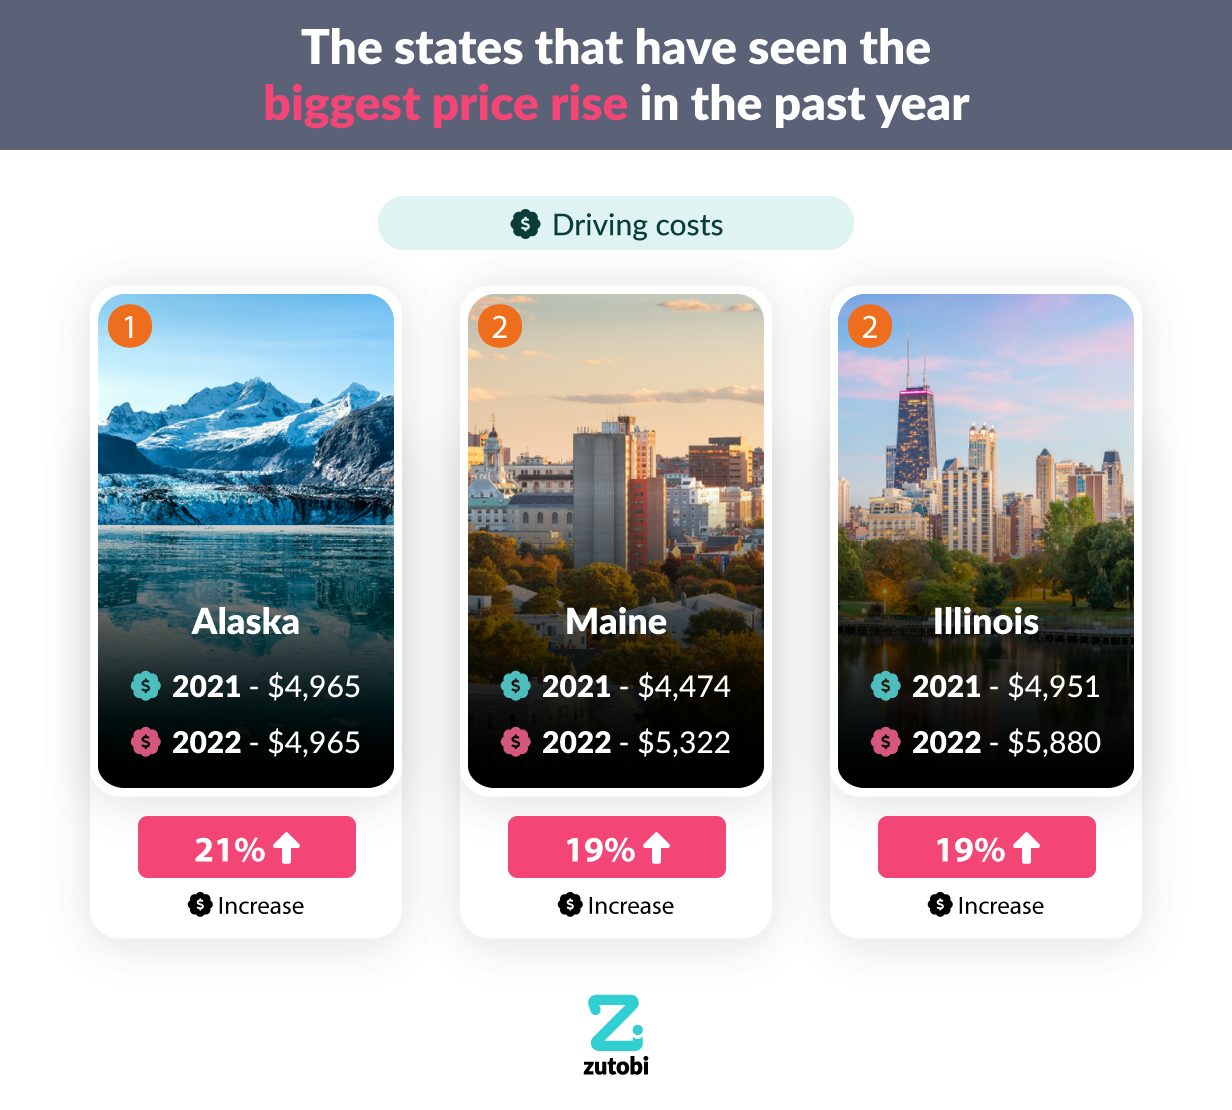
The states that have seen the biggest price rise in the past year
1 – Alaska
2021 Average Driving Costs – $4,965
2022 Average Driving Costs – $6,000
Increase in Driving Costs – 21%
The remote northwestern state of Alaska is where drivers have been hit the most by the rising cost of driving. It was the only state where prices rose by over 20%, driven by a 68% rise in fuel costs.
2 – Maine
2021 Average Driving Costs – $4,474
2022 Average Driving Costs – $5,322
Increase in Driving Costs – 19%
Maine was one of a number of states where costs rose by 19%, but it is fractionally ahead of the others to rank second.
3 – Illinois
2021 Average Driving Costs – $4,951
2022 Average Driving Costs – $5,880
Increase in Driving Costs – 19%
Illinois also suffered from a 19% rise in the cost of driving for the average motorist in the state. The fuel costs increased by a slightly lower 0.13% than they did in Maine.
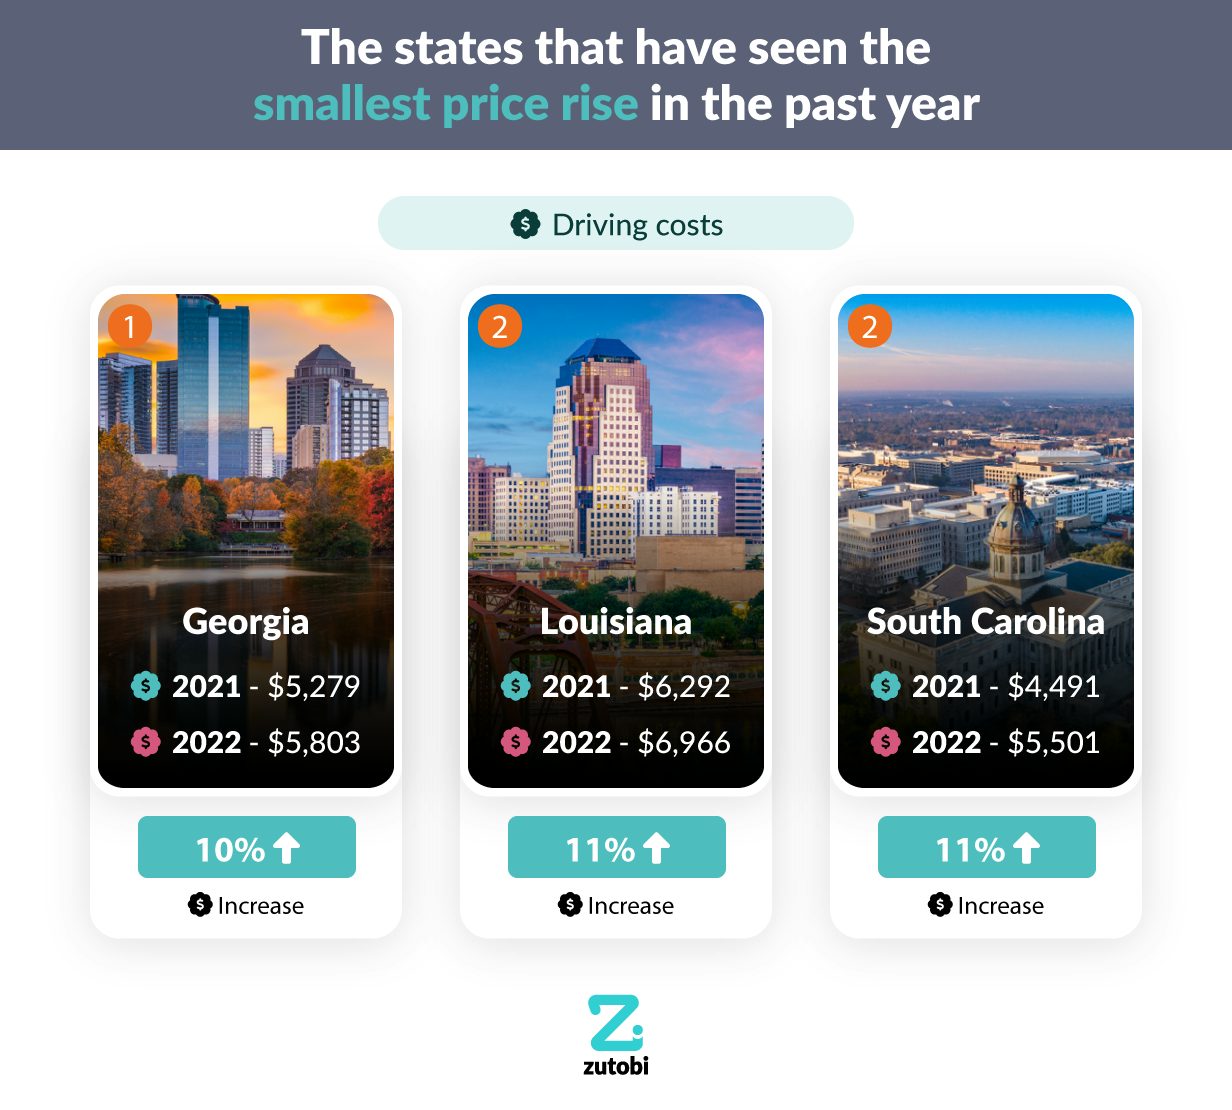
The states that have seen the smallest price rise in the past year
1 – Georgia
2021 Average Driving Costs – $5,279
2022 Average Driving Costs – $5,803
Increase in Driving Costs – 10%
Georgia is at the other end of the spectrum, there has only been a 10% increase in the average annual cost of driving. It is one of only three states where the cost of fuel has increased by less than 50%.
2 – Louisiana
2021 Average Driving Costs – $6,292
2022 Average Driving Costs – $6,966
Increase in Driving Costs – 11%
Louisiana has average annual costs of almost $1,500 more than those in Georgia, but they have only risen by 1% more in the past year.
3 – South Carolina
2021 Average Driving Costs – $4,491
2022 Average Driving Costs – $5,501
Increase in Driving Costs – 11%
South Carolina has seen its prices rise by over $1,000, to break the $5,000 a year barrier, but they have risen considerably less than other states.
The Rising Cost of Owning and Running a Car in the US
To discover how the cost of car ownership has changed across the entire United States in the past ten years and how we predict it will change in the future, we have taken the costs in every state to discover a national average in depreciation, fuel and insurance costs.
Rising Cost of the Ford F-150
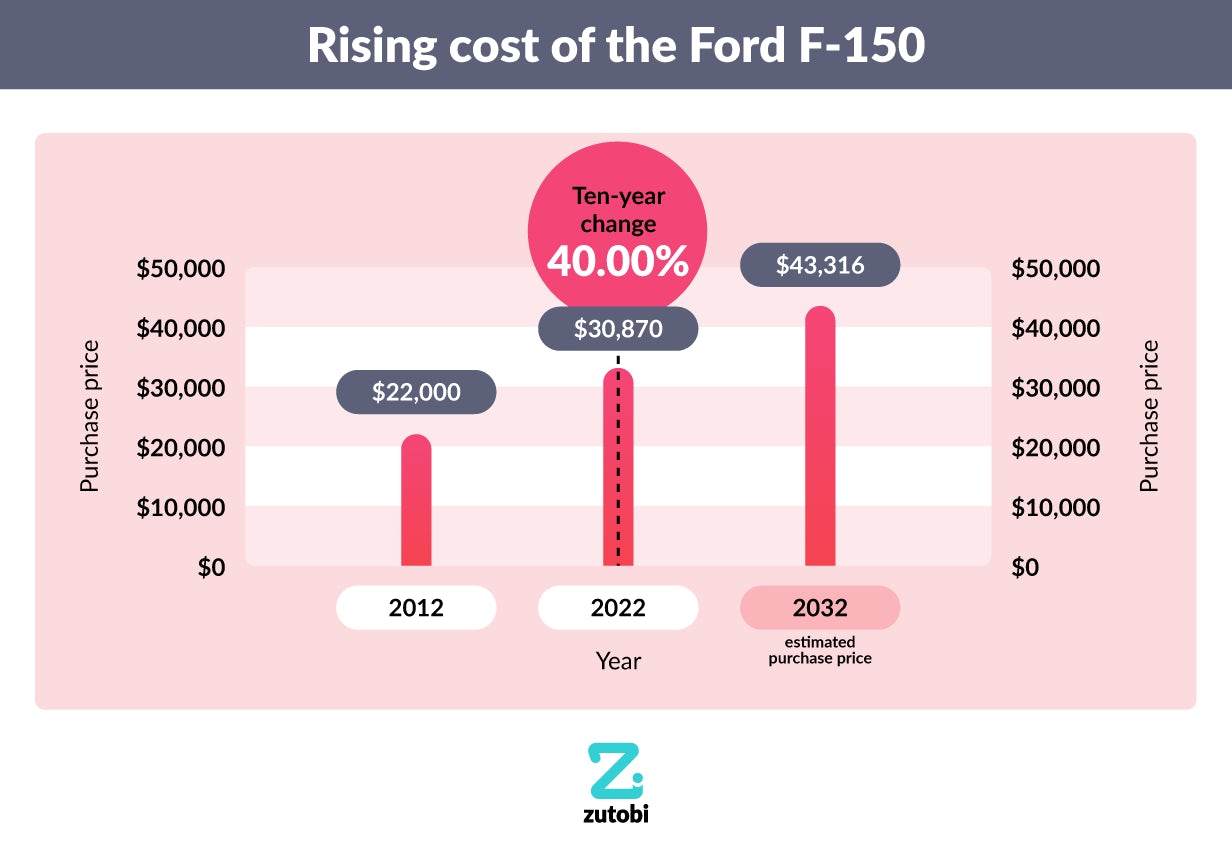
The best-selling car in the USA consistently over the past decades has been the Ford F-150 pickup truck, when it was introduced in 1948 it only cost $1,279. Since then it has gotten bigger and better, and in 2012 the twelfth generation of the vehicle cost $22,000 dollars when new. Today the price is $30,870, which shows a 40% price increase in the past decade. Since the last report, Ford launched the fourteenth generation of the F150 which costs $4,255 more than the previous model, however, the new version depreciates much less ($273 per year on average). Apply this to the cost going forward and we estimate that the value of the F-150 will rise to $43,316 in 2032.
Change in Ownership Costs
Fuel
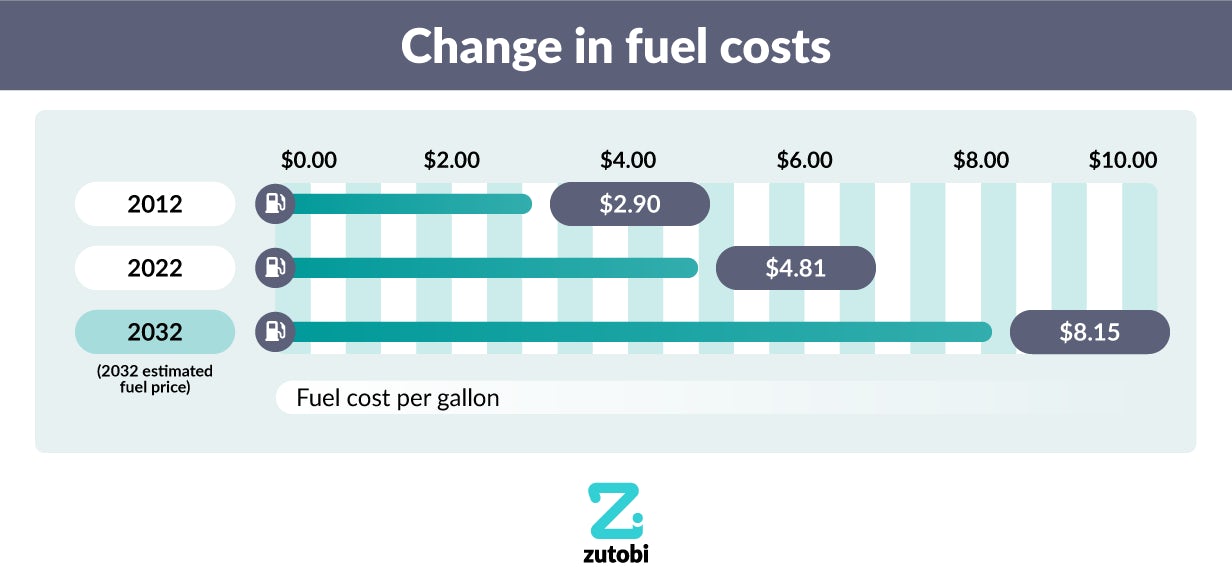
Prior to the oil crisis of the 1970s petrol prices in the USA remained stable at 30-40 cents per gallon on average across the country, this is a massive difference compared to the average of $3.81 today. Just in the past year, it has jumped up from $3.03, an enormous rise of $1.78.
In 2012 the nationwide fuel price average was $2.90 meaning that in a decade prices had risen by $1.91 cents per gallon, equating to a 68% increase in costs. When applying this to our future projections we estimated that fuel costs will only rise to $8.15 per gallon in 2032 providing prices continue to rise at their current rate.
Insurance
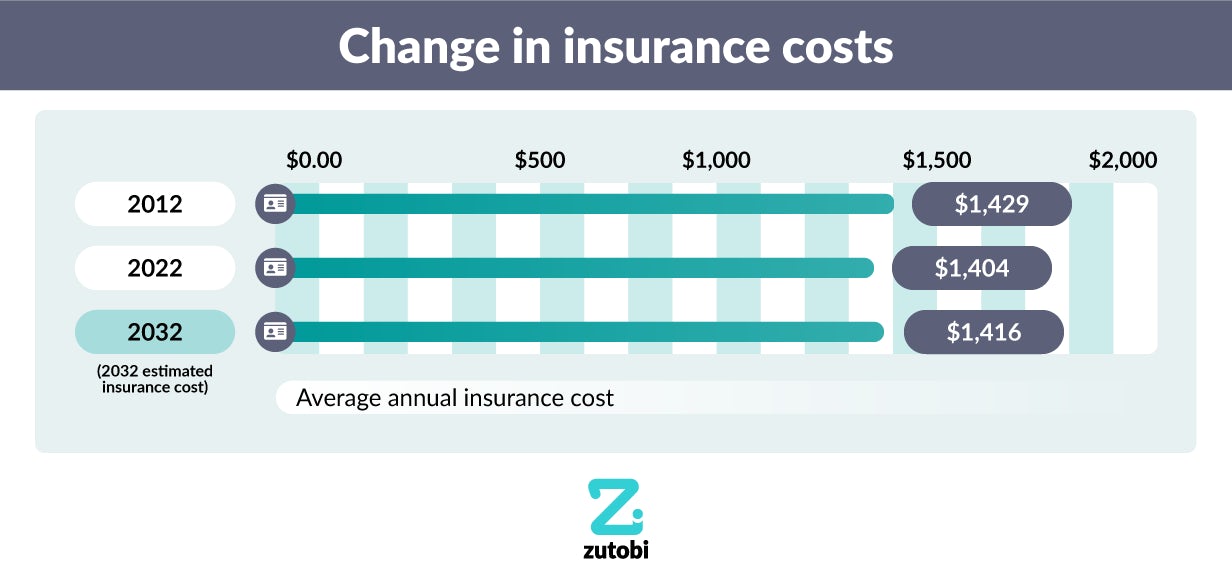
While fuel prices are on the rise across the country, average insurance premiums are actually reducing in the United States. The average cost of insurance in 2012 was $1,429 per annum, which is $25 more than the average cost today of $1,404 (the same as it was last year), when applying this to future predictions we discover that there is a 0.91% decrease which would result in estimated costs of $1,416 in ten years time.
Vehicle Depreciation
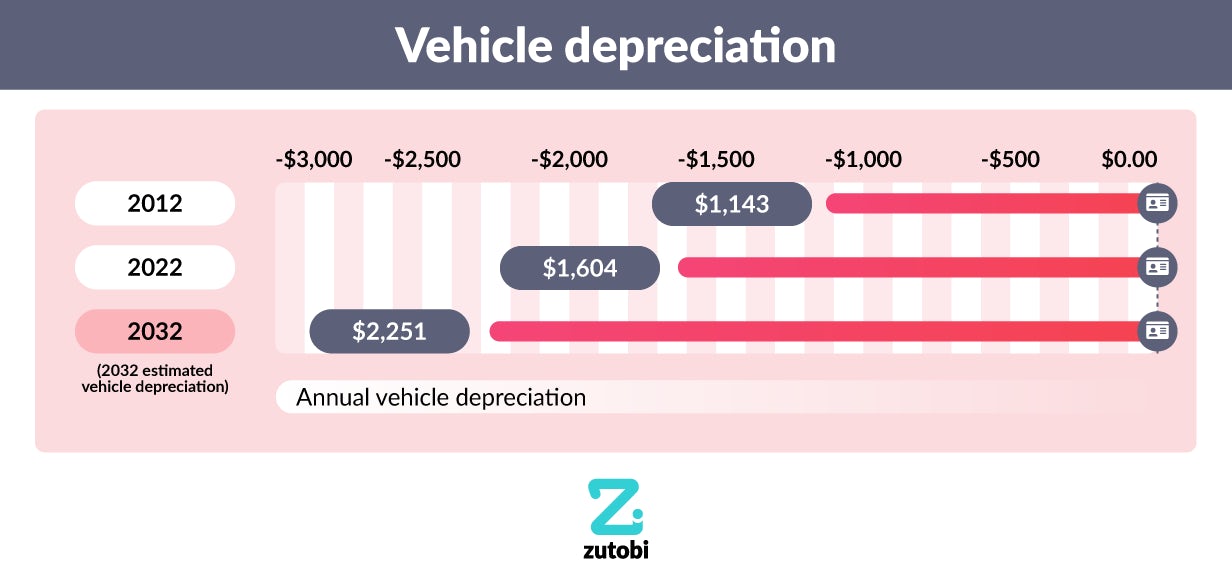
On average, the Ford F-150 has depreciated by 31.18% of the vehicle’s original purchase value. This means that in 2012 if you purchased your car new for $22,000, it would cost you an average of $1,143 in annual depreciation costs. Today the F-150 costs $30,870, so after six years it would have depreciated by $9,624, or $1,604 per year. Therefore, we predict that by 2032 you will be paying an estimated $43,316.22 for the car, and will lose $2,250 every year that you own it.
The most expensive states to own and run a car for a year today
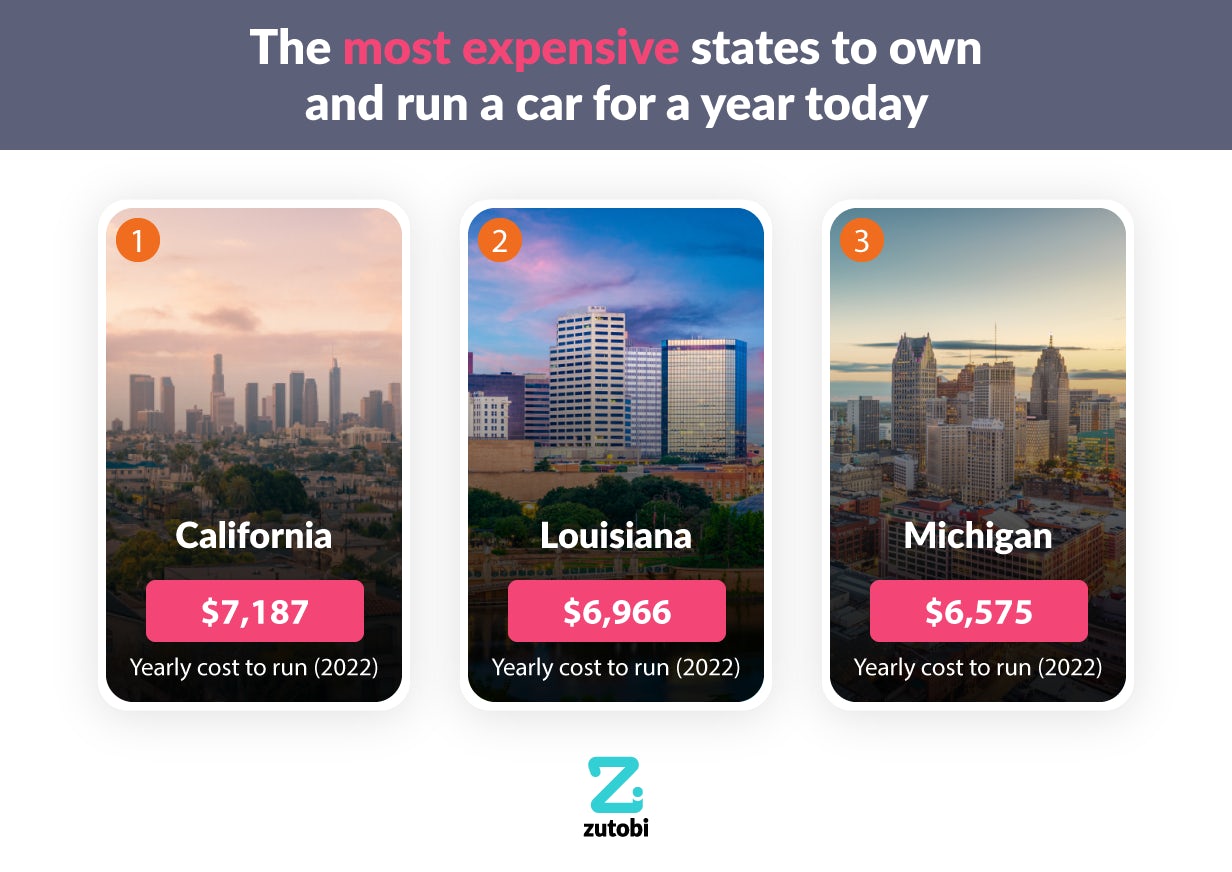
1 – California, $7,187
California is currently the most expensive state to run the F-150 for a year, as the only state with a total average cost of over $7,000. Fuel is $6.24 per gallon, which equates to $3,617 per year on average. It also has high average insurance costs of $1,966 per year, the fourth most expensive state for insurance.
2 – Louisiana, $6,966
The southern state of Louisiana is the second most expensive state to run a car, costs are only $121 less than in California. The annual average insurance premium is almost $1,000 more expensive in Louisiana, but the fuel costs are over $1,000 less than in the Golden State.
3 – Michigan, $6,575
Michigan and Louisiana are almost at polar opposite ends of the country, but they are next-door neighbours in the rankings. Average annual fuel costs are $2,859 ($4.93 per gallon), and average insurance costs are $2,112.
The least expensive states to own and run a car for a year today
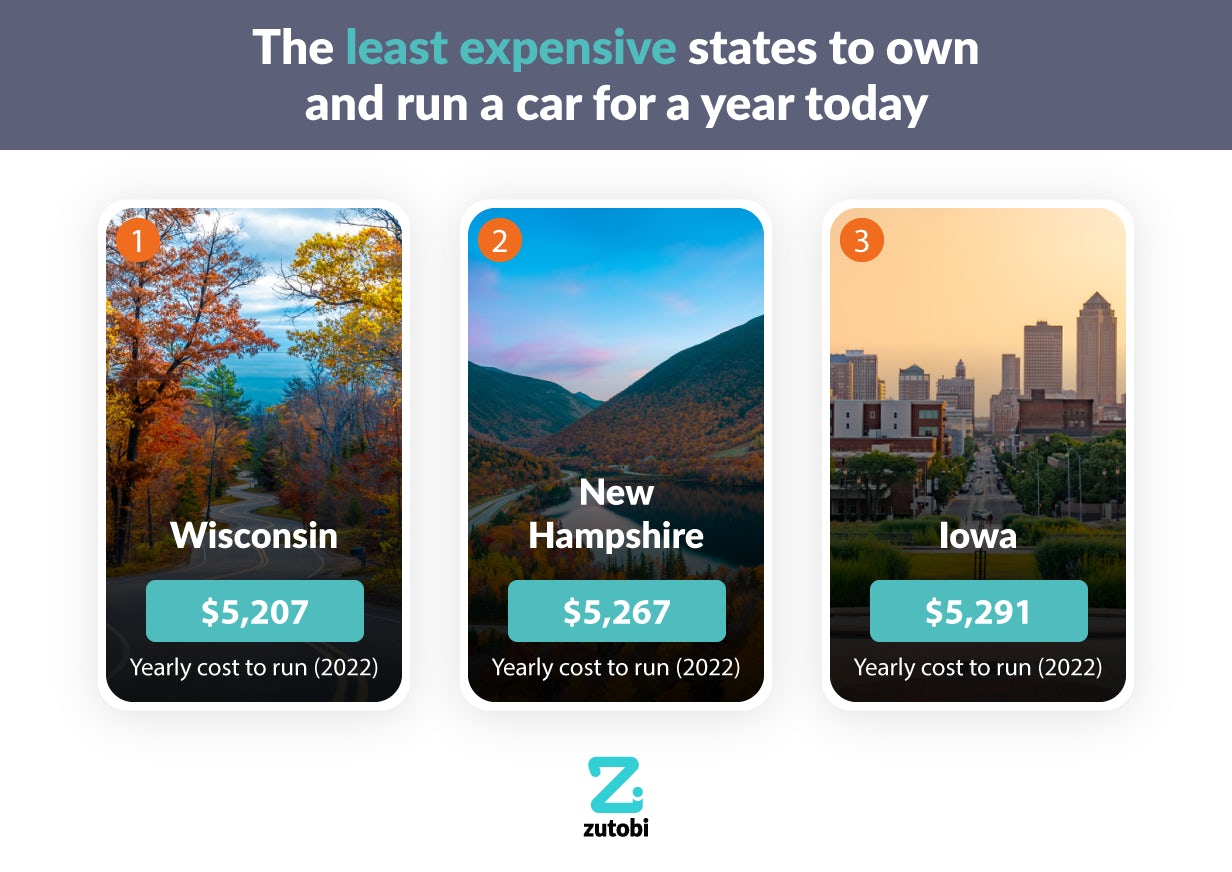
1 – Wisconsin, $5,207
Wisconsin is the best value state for running a car, with average annual costs totalling $5,207, this is almost $2,000 less than the cost in California. The main reason for this is the very low average insurance cost of $938, meanwhile, fuel costs are in the cheapest third of states.
2 – New Hampshire, $5,267
The average annual cost in New Hampshire is exactly $60 more than in Wisconsin, and they similarly have very low average insurance costs ($885 per year). This is the second-lowest of any state, but fuel is more expensive
3 – Iowa, $5,291
Second and third place on the rankings is separated by a minuscule $24, with Iowa the slightly more expensive. Fuel costs in Iowa are only $2,655 per year on average, but insurance costs are over $1,000.
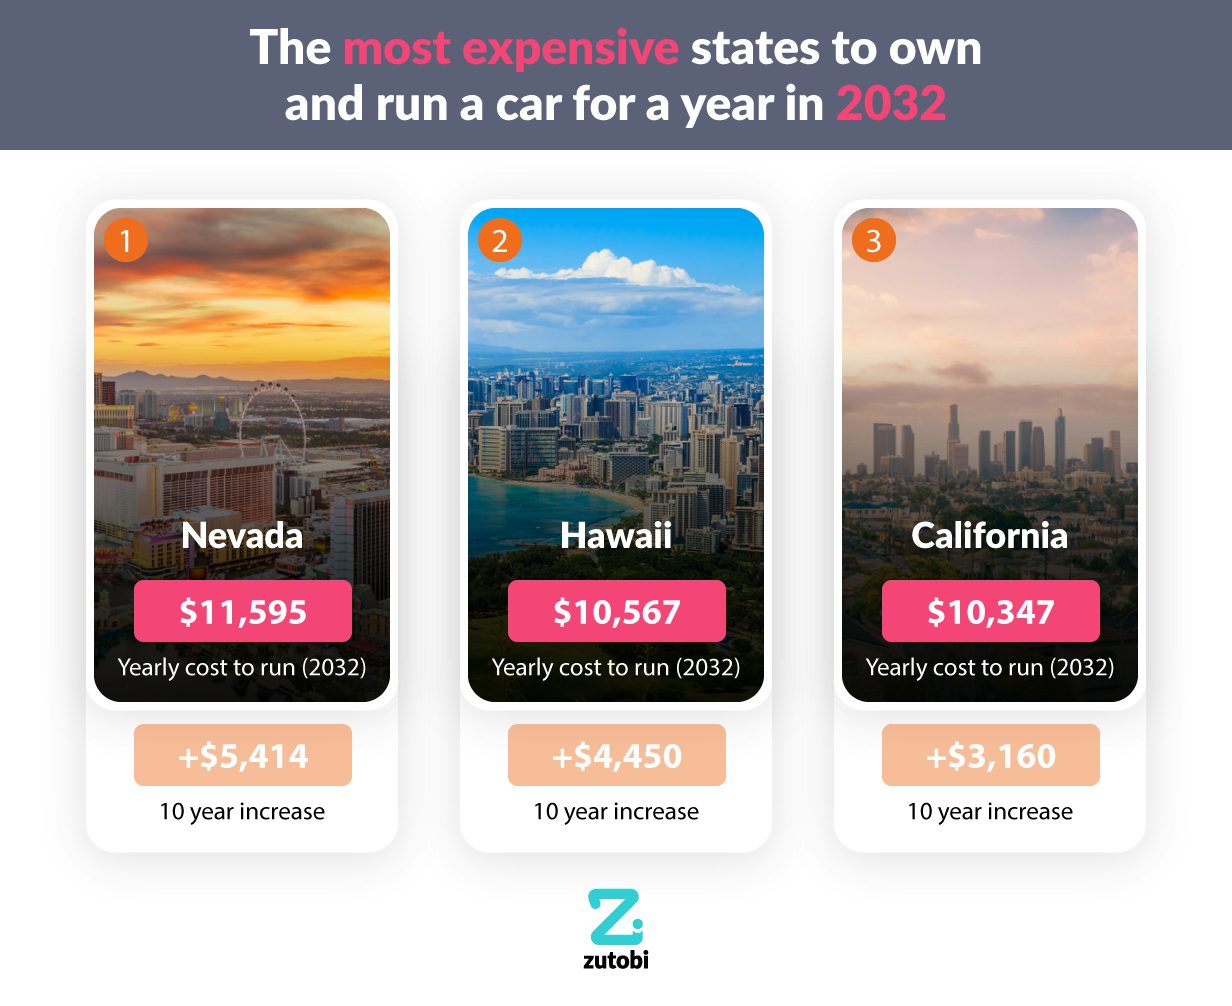
The most expensive states to own and run a car for a year in 2032
Back in 2012 Louisiana was the most expensive state to own and run a car, with annual costs of $5,263. It was still the most expensive in 2021 with average annual costs of $6,292. However, in the last year, they have dropped to the second most expensive, and by 2032 they will only be the seventh most expensive.
1 – Nevada, $11,595 ($5,414 increase):
Nevada will be the most expensive state to own and run a car in 2032, it will cost just over $11,500 to own and run a car for a year. Today Nevada is only the seventh most expensive state at $6,181, but their rapid rise will be chiefly due to the fastest rising fuel costs of 144% in a decade. They also rank in the top ten for the highest rising annual insurance costs.
2 – Hawaii, $10,567 ($4,450 increase):
Hawaii will be the second most expensive state in ten years. Despite the average annual cost of insurance dropping to below $1,000, overall costs have risen by 73% in the state. By 2032, we estimate that annual fuel costs will be $7,329.
3 – California, $10,347 ($3,160 increase):
Today the golden state is the most expensive place to own and run the F-150, but in ten years’ time, it will only be the third most expensive. By 2032, it will be the last state where average annual costs are over $10,000. Overall ten year growth of costs in California is only 44%, far less than the two states that will have leapfrogged it in the rankings.
The least expensive states to own and run a car for a year in 2032
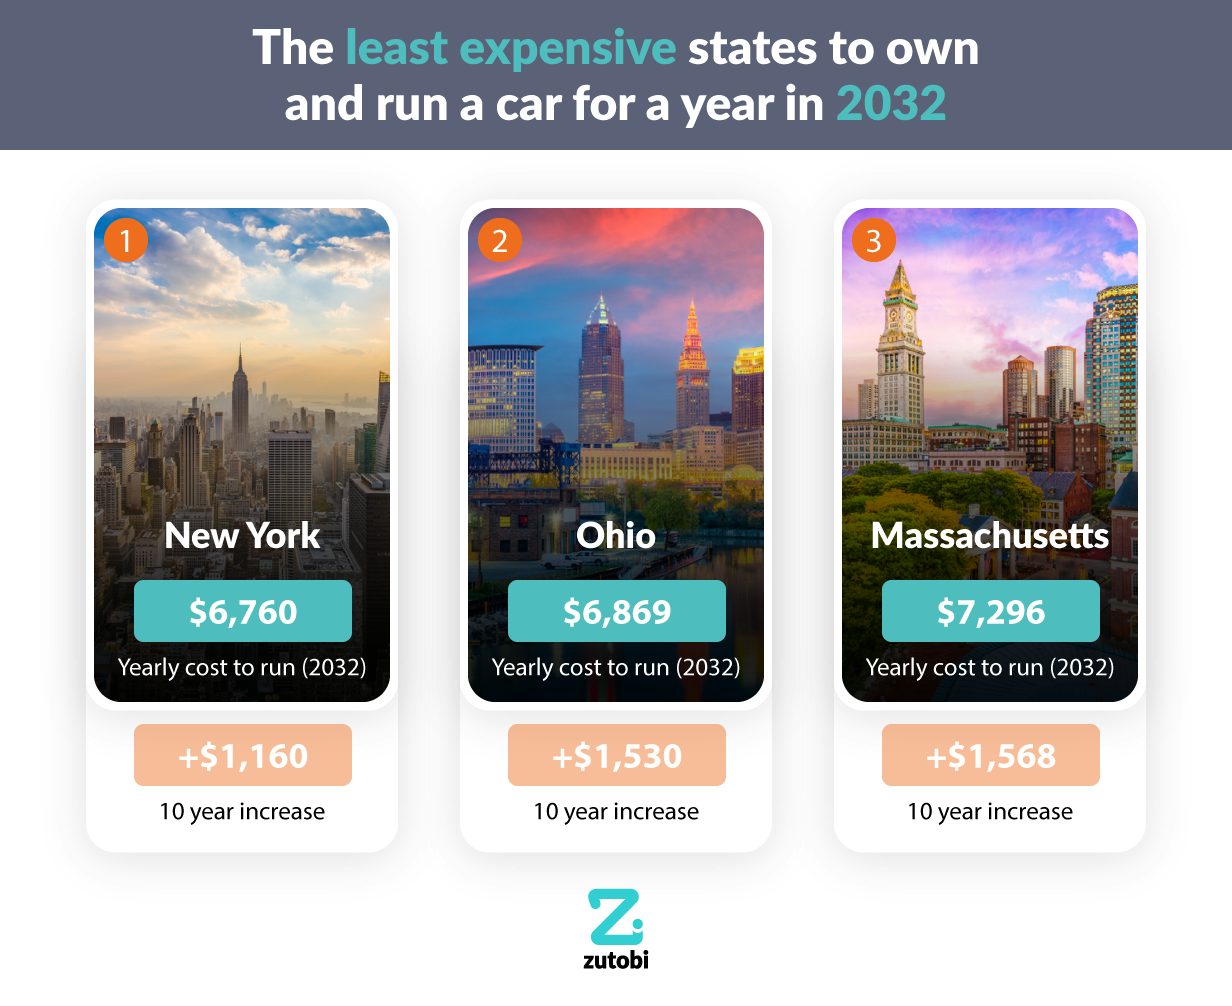
At the other end of the cost scale, there are some states where it is considerably cheaper to own and run a car than others. Today the cheapest state is Wisconsin, with costs of $5,207 per year, in ten years it will only be the sixth cheapest state. Ten years ago in 2012, Maine was the cheapest state, but it will shoot up to the 17th most expensive by 2032, with costs increasing by over 140%.
1 – New York, $6,760 ($1,160 increase):
For those living in the state of New York, prices are rising by a very low amount of 21%. As a result, it will be the cheapest state in terms of average annual motoring costs in 2032. It will have the third-lowest fuel price ($3,334), and average insurance costs under $1,000 per year.
2 – Ohio, $6,869 ($1,530 increase):
Today, the cost of running a car in Ohio for a year is over $200 less than in New York. But, in ten years’ time, it is estimated to be over $100 more. Although this means that it will still be very close between costs in the two states, Ohio’s prices are rising 8% faster.
3 – Massachusetts, $7,296 ($1,568 increase):
Massachusetts will have dropped dramatically in the rankings over the next decade, becoming the third cheapest state to own and run the F-150, compared to the 27th cheapest today. This is mainly due to it having the third smallest price increase rate of 27%.
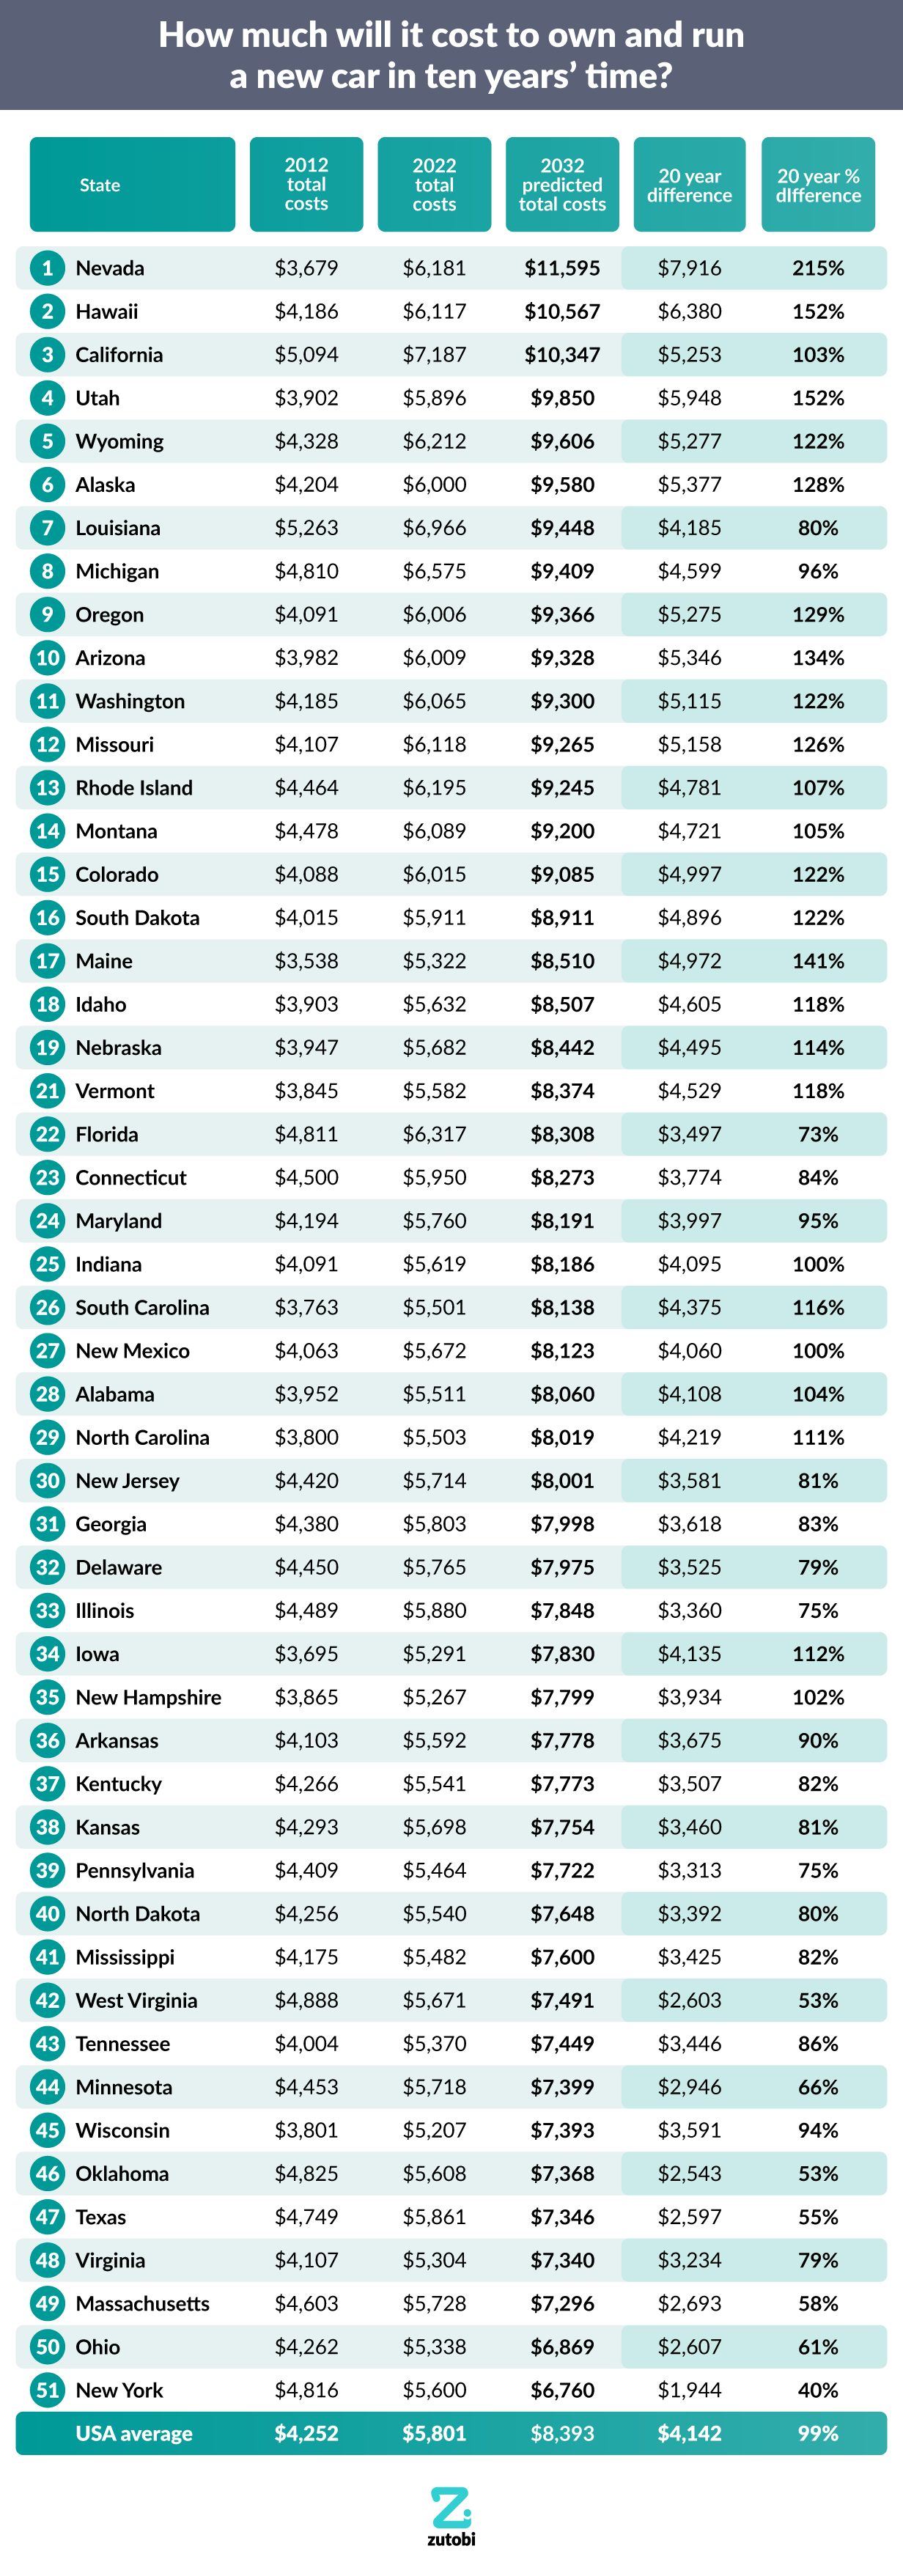
How much will it cost to own and run a new car in ten years’ time?
Methodology
We used a number of factors to calculate the cost of owning and running a Ford F-150 in every state today, these factors are: depreciation over a six-year period, insurance, and fuel costs.
We also found figures for these same factors from ten years ago to see the increase or decrease in costs in each state over the past decade.
By following these trends we were able to predict the value of owning and running a Ford F-150 ten years from now if current trends continue.
The Ford F-150 was chosen as it is the best-selling car in the United States of America.
Car Depreciation Price
- To find the price of the Ford F-150 over the years we used data from https://www.thedrive.com/news/34333/heres-how-much-the-ford-f-150-has-increased-in-price-over-the-decades
- The F-150 was chosen as it is America’s best-selling car: https://www.forbes.com/consent/?toURL=https://www.forbes.com/wheels/news/best-selling-cars-suvs-pickups-2021/
- We looked at owning a car for six years as this is the average length of car ownership.
- By using the car depreciation calculator we were able to discover the estimated value of a Ford F-150 after six years with an average annual mileage of 15,000 miles. (The closest distance on the calculator to the 14,300 miles that is the average driven in the US per year) https://caredge.com/ford/f-150/depreciation?y=0&p=28940&o=5&m=10500
- We then divided this total amount of depreciation by six to discover the average depreciation cost per year of ownership.
Insurance
- To find the 2012 insurance prices we used https://web.archive.org/web/20110316115125/https://www.insure.com/car-insurance/car-insurance-rates.html
- And for 2021 prices we used data from https://www.insure.com/car-insurance/car-insurance-rates.html#average-cost-of-car-insurance-by-state
- We calculated the difference between costs to see which states had the biggest increase and decrease in insurance costs.
Fuel Costs
- We decided to use regular unleaded petrol (gas) as that is the most popular fuel type in the country.
- To find out the fuel costs for each state from 2011 (unfortunately, this was the last year data was publicly made available) we used data from https://www.eia.gov/dnav/pet/hist/LeafHandler.ashx?n=PET&s=EMA_EPM0_PRA_SAL_DPG&f=M for each different state.
- The 2022 data was found at https://gasprices.aaa.com/
- We then worked out the average amount of fuel needed in a year by finding out the average annual gallons required based on the MPG of the F-150 and the average annual mileage of 14,300. https://www.thezebra.com/resources/driving/average-miles-driven-per-year/
- We then multiplied the total amount of gallons needed by the price per gallon to discover the average annual fuel costs.
Predicting the Future
Once we had average prices for both 2012 and 2022, we calculated the percentage change between the prices for the two years, before applying that percentage change to the 2022 prices to estimate how these might look in ten years’ time.
Take our full course with tests and theory
600+ exam-like questions and practice tests
Easy summarized DMV handbook
America’s #1 driver’s ed app with a 95.8% pass rate
Recommended articles


Ace your DMV test, guaranteed
Want to Be the Top School in Your Area?
- Simple & automated admin
- More time for teaching
- #1 learning materials for students
Start learning now
Resources
- Driver’s License Renewal
- How to Get Your US Driver’s License
- How to Prepare for Your Road Test
- How to Get a Driver’s Permit
- Behind-The-Wheel training
- Courses
- Blog
- FAQ
Show More
©2026 Zutobi AB, 4 Peddlers Row, Unit #103, Newark, DE 19702